
A modern illustration of each state's landscape uses 3DEP data to showcase subtle beauty in their elevation differences like never before. Every state has been consistently adjusted and colorized using the seamless 3DEP 1/3rd arc-second data according to its highest and lowest elevations, which helps accentuate differences even in states with low relief.
Images
The 3DEP Multimedia Gallery is a collection of graphics related to elevation data. All items in this gallery are considered public domain unless otherwise noted.
Filter Total Items: 165
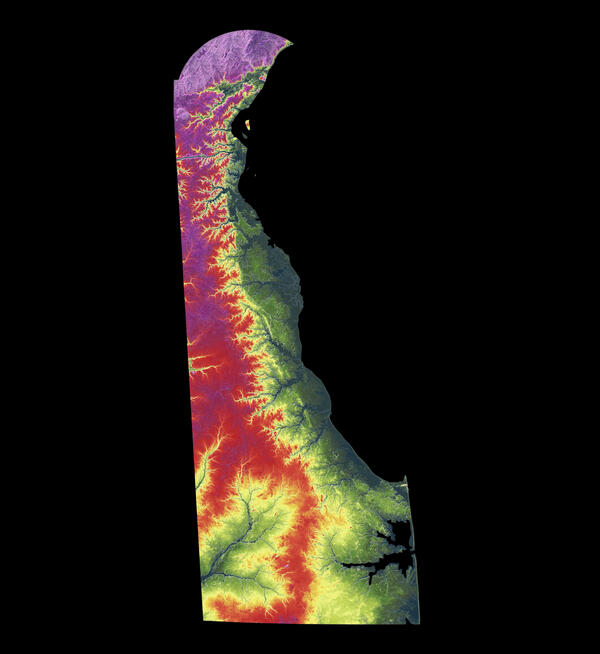
3DEP As Art - Delaware
A modern illustration of each state's landscape uses 3DEP data to showcase subtle beauty in their elevation differences like never before. Every state has been consistently adjusted and colorized using the seamless 3DEP 1/3rd arc-second data according to its highest and lowest elevations, which helps accentuate differences even in states with low relief.
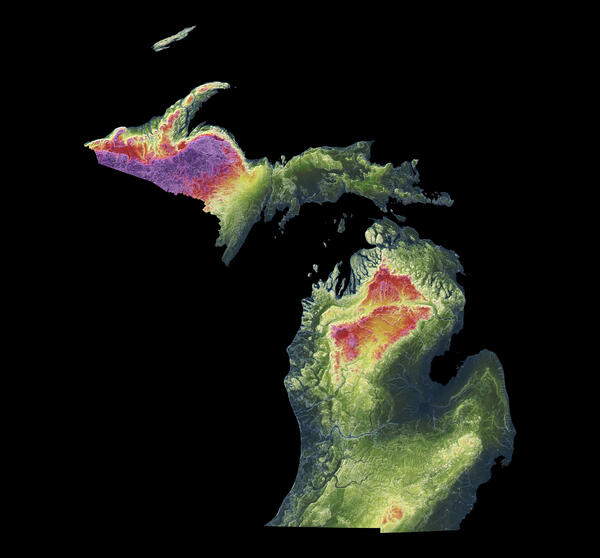
3DEP As Art - Michigan
A modern illustration of each state's landscape uses 3DEP data to showcase subtle beauty in their elevation differences like never before. Every state has been consistently adjusted and colorized using the seamless 3DEP 1/3rd arc-second data according to its highest and lowest elevations, which helps accentuate differences even in states with low relief.
A modern illustration of each state's landscape uses 3DEP data to showcase subtle beauty in their elevation differences like never before. Every state has been consistently adjusted and colorized using the seamless 3DEP 1/3rd arc-second data according to its highest and lowest elevations, which helps accentuate differences even in states with low relief.
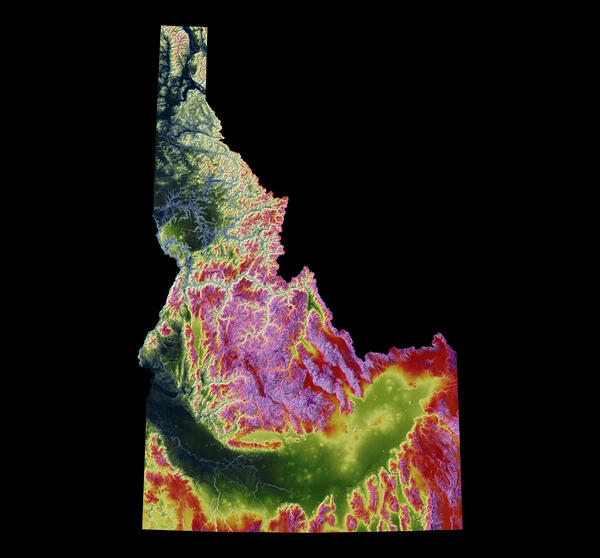
3DEP As Art - Idaho
A modern illustration of each state's landscape uses 3DEP data to showcase subtle beauty in their elevation differences like never before. Every state has been consistently adjusted and colorized using the seamless 3DEP 1/3rd arc-second data according to its highest and lowest elevations, which helps accentuate differences even in states with low relief.
A modern illustration of each state's landscape uses 3DEP data to showcase subtle beauty in their elevation differences like never before. Every state has been consistently adjusted and colorized using the seamless 3DEP 1/3rd arc-second data according to its highest and lowest elevations, which helps accentuate differences even in states with low relief.
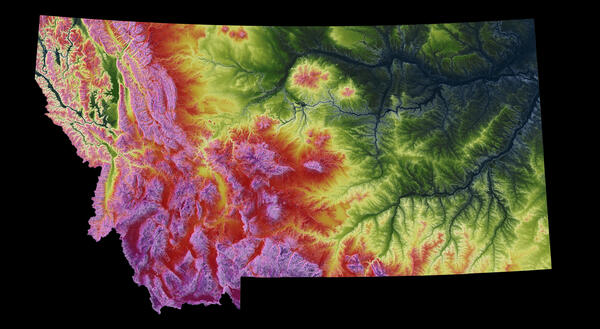
3DEP As Art - Montana
A modern illustration of each state's landscape uses 3DEP data to showcase subtle beauty in their elevation differences like never before. Every state has been consistently adjusted and colorized using the seamless 3DEP 1/3rd arc-second data according to its highest and lowest elevations, which helps accentuate differences even in states with low relief.
A modern illustration of each state's landscape uses 3DEP data to showcase subtle beauty in their elevation differences like never before. Every state has been consistently adjusted and colorized using the seamless 3DEP 1/3rd arc-second data according to its highest and lowest elevations, which helps accentuate differences even in states with low relief.
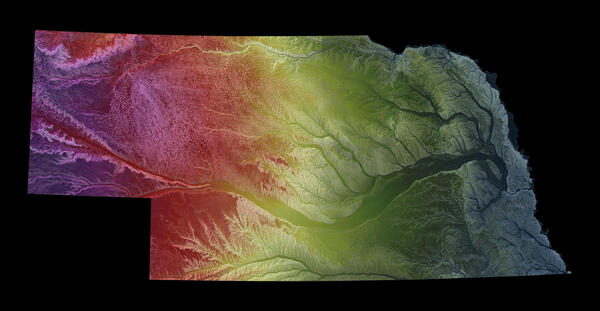
3DEP As Art - Nebraska
A modern illustration of each state's landscape uses 3DEP data to showcase subtle beauty in their elevation differences like never before. Every state has been consistently adjusted and colorized using the seamless 3DEP 1/3rd arc-second data according to its highest and lowest elevations, which helps accentuate differences even in states with low relief.
A modern illustration of each state's landscape uses 3DEP data to showcase subtle beauty in their elevation differences like never before. Every state has been consistently adjusted and colorized using the seamless 3DEP 1/3rd arc-second data according to its highest and lowest elevations, which helps accentuate differences even in states with low relief.
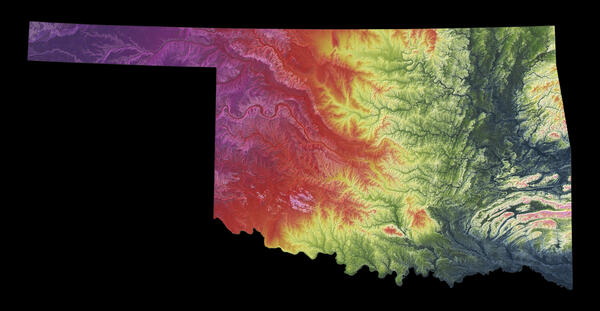
3DEP As Art - Oklahoma
A modern illustration of each state's landscape uses 3DEP data to showcase subtle beauty in their elevation differences like never before. Every state has been consistently adjusted and colorized using the seamless 3DEP 1/3rd arc-second data according to its highest and lowest elevations, which helps accentuate differences even in states with low relief.
A modern illustration of each state's landscape uses 3DEP data to showcase subtle beauty in their elevation differences like never before. Every state has been consistently adjusted and colorized using the seamless 3DEP 1/3rd arc-second data according to its highest and lowest elevations, which helps accentuate differences even in states with low relief.
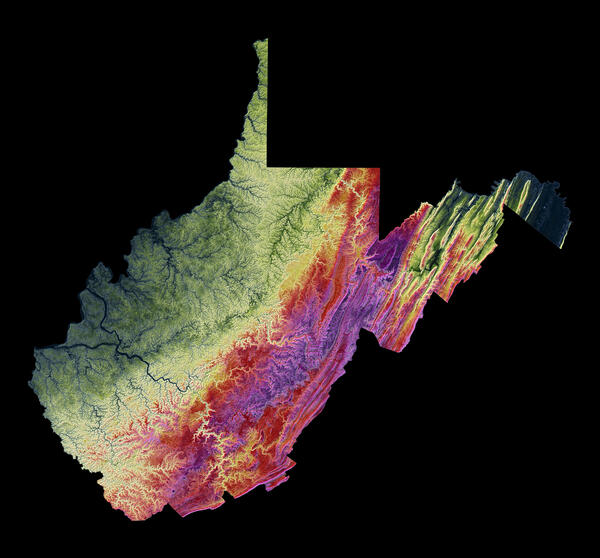
3DEP As Art - West Virginia
A modern illustration of each state's landscape uses 3DEP data to showcase subtle beauty in their elevation differences like never before. Every state has been consistently adjusted and colorized using the seamless 3DEP 1/3rd arc-second data according to its highest and lowest elevations, which helps accentuate differences even in states with low relief.
A modern illustration of each state's landscape uses 3DEP data to showcase subtle beauty in their elevation differences like never before. Every state has been consistently adjusted and colorized using the seamless 3DEP 1/3rd arc-second data according to its highest and lowest elevations, which helps accentuate differences even in states with low relief.
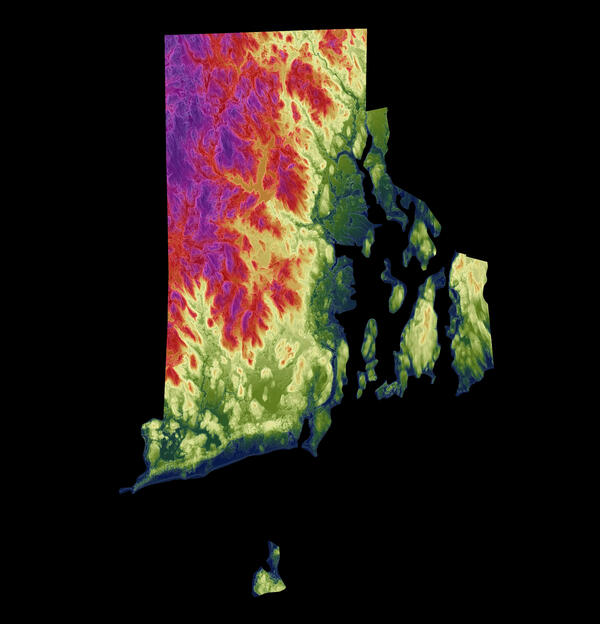
3DEP As Art - Rhode Island
A modern illustration of each state's landscape uses 3DEP data to showcase subtle beauty in their elevation differences like never before. Every state has been consistently adjusted and colorized using the seamless 3DEP 1/3rd arc-second data according to its highest and lowest elevations, which helps accentuate differences even in states with low relief.
A modern illustration of each state's landscape uses 3DEP data to showcase subtle beauty in their elevation differences like never before. Every state has been consistently adjusted and colorized using the seamless 3DEP 1/3rd arc-second data according to its highest and lowest elevations, which helps accentuate differences even in states with low relief.
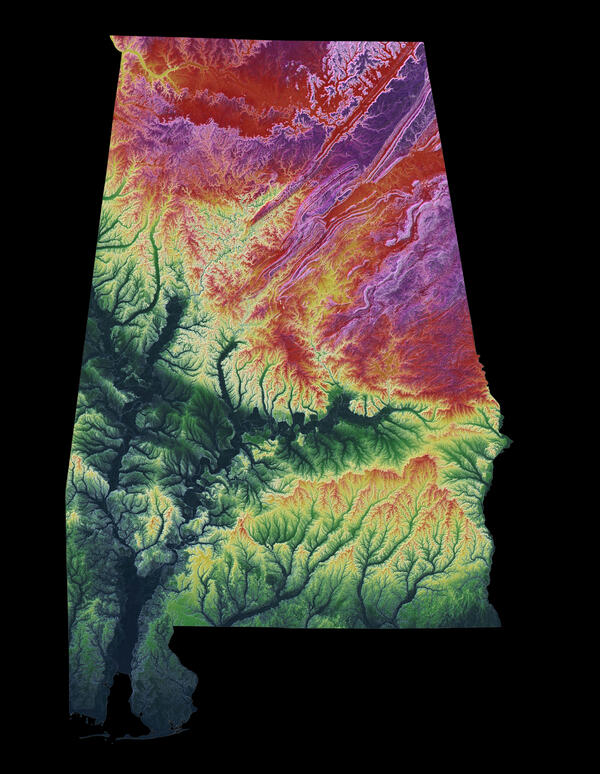
3DEP As Art - Alabama
A modern illustration of each state's landscape uses 3DEP data to showcase subtle beauty in their elevation differences like never before. Every state has been consistently adjusted and colorized using the seamless 3DEP 1/3rd arc-second data according to its highest and lowest elevations, which helps accentuate differences even in states with low relief.
A modern illustration of each state's landscape uses 3DEP data to showcase subtle beauty in their elevation differences like never before. Every state has been consistently adjusted and colorized using the seamless 3DEP 1/3rd arc-second data according to its highest and lowest elevations, which helps accentuate differences even in states with low relief.
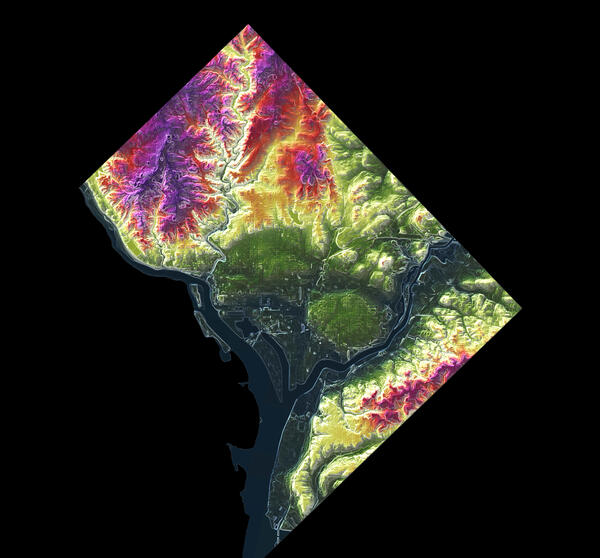
3DEP As Art - District of Columbia
A modern illustration of each state's landscape uses 3DEP data to showcase subtle beauty in their elevation differences like never before. Every state has been consistently adjusted and colorized using the seamless 3DEP 1/3rd arc-second data according to its highest and lowest elevations, which helps accentuate differences even in states with low relief.
A modern illustration of each state's landscape uses 3DEP data to showcase subtle beauty in their elevation differences like never before. Every state has been consistently adjusted and colorized using the seamless 3DEP 1/3rd arc-second data according to its highest and lowest elevations, which helps accentuate differences even in states with low relief.
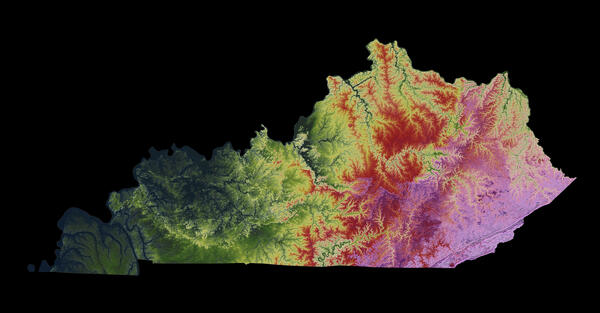
3DEP As Art - Kentucky
A modern illustration of each state's landscape uses 3DEP data to showcase subtle beauty in their elevation differences like never before. Every state has been consistently adjusted and colorized using the seamless 3DEP 1/3rd arc-second data according to its highest and lowest elevations, which helps accentuate differences even in states with low relief.
A modern illustration of each state's landscape uses 3DEP data to showcase subtle beauty in their elevation differences like never before. Every state has been consistently adjusted and colorized using the seamless 3DEP 1/3rd arc-second data according to its highest and lowest elevations, which helps accentuate differences even in states with low relief.
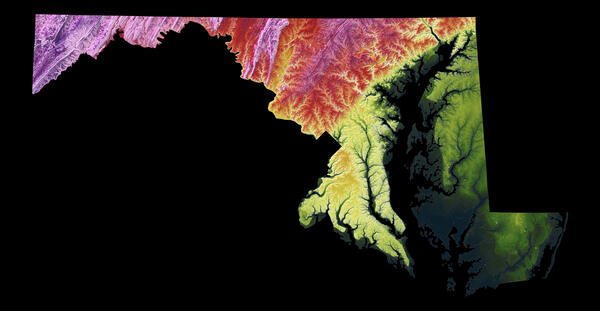
3DEP As Art - Maryland
A modern illustration of each state's landscape uses 3DEP data to showcase subtle beauty in their elevation differences like never before. Every state has been consistently adjusted and colorized using the seamless 3DEP 1/3rd arc-second data according to its highest and lowest elevations, which helps accentuate differences even in states with low relief.
A modern illustration of each state's landscape uses 3DEP data to showcase subtle beauty in their elevation differences like never before. Every state has been consistently adjusted and colorized using the seamless 3DEP 1/3rd arc-second data according to its highest and lowest elevations, which helps accentuate differences even in states with low relief.
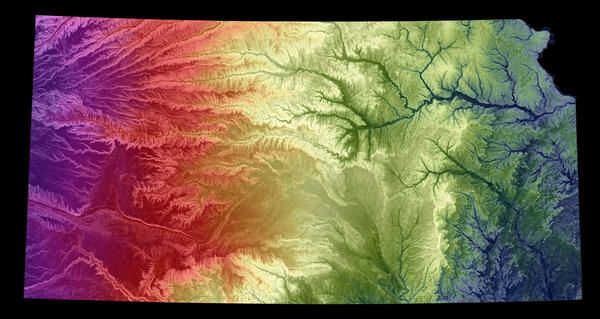
3DEP As Art - Kansas
A modern illustration of each state's landscape uses 3DEP data to showcase subtle beauty in their elevation differences like never before. Every state has been consistently adjusted and colorized using the seamless 3DEP 1/3rd arc-second data according to its highest and lowest elevations, which helps accentuate differences even in states with low relief.
A modern illustration of each state's landscape uses 3DEP data to showcase subtle beauty in their elevation differences like never before. Every state has been consistently adjusted and colorized using the seamless 3DEP 1/3rd arc-second data according to its highest and lowest elevations, which helps accentuate differences even in states with low relief.
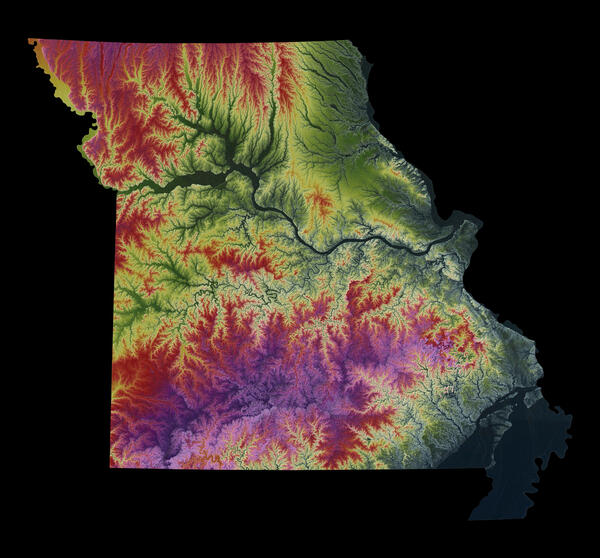
3DEP As Art - Missouri
A modern illustration of each state's landscape uses 3DEP data to showcase subtle beauty in their elevation differences like never before. Every state has been consistently adjusted and colorized using the seamless 3DEP 1/3rd arc-second data according to its highest and lowest elevations, which helps accentuate differences even in states with low relief.
A modern illustration of each state's landscape uses 3DEP data to showcase subtle beauty in their elevation differences like never before. Every state has been consistently adjusted and colorized using the seamless 3DEP 1/3rd arc-second data according to its highest and lowest elevations, which helps accentuate differences even in states with low relief.
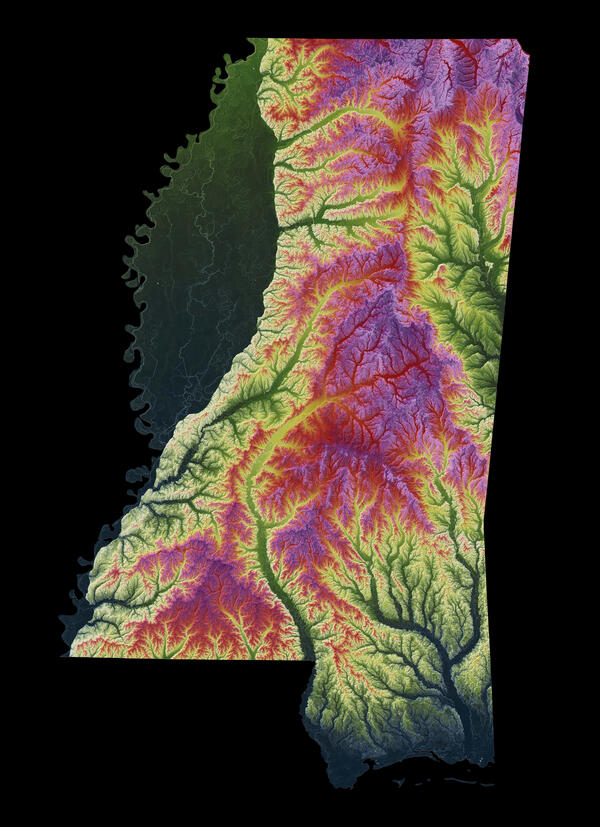
3DEP As Art - Mississippi
A modern illustration of each state's landscape uses 3DEP data to showcase subtle beauty in their elevation differences like never before. Every state has been consistently adjusted and colorized using the seamless 3DEP 1/3rd arc-second data according to its highest and lowest elevations, which helps accentuate differences even in states with low relief.
A modern illustration of each state's landscape uses 3DEP data to showcase subtle beauty in their elevation differences like never before. Every state has been consistently adjusted and colorized using the seamless 3DEP 1/3rd arc-second data according to its highest and lowest elevations, which helps accentuate differences even in states with low relief.
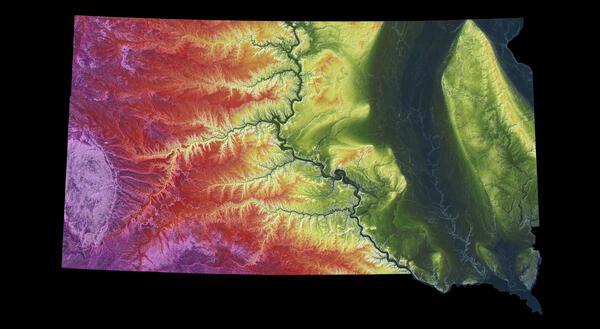
3DEP As Art - South Dakota
A modern illustration of each state's landscape uses 3DEP data to showcase subtle beauty in their elevation differences like never before. Every state has been consistently adjusted and colorized using the seamless 3DEP 1/3rd arc-second data according to its highest and lowest elevations, which helps accentuate differences even in states with low relief.
A modern illustration of each state's landscape uses 3DEP data to showcase subtle beauty in their elevation differences like never before. Every state has been consistently adjusted and colorized using the seamless 3DEP 1/3rd arc-second data according to its highest and lowest elevations, which helps accentuate differences even in states with low relief.
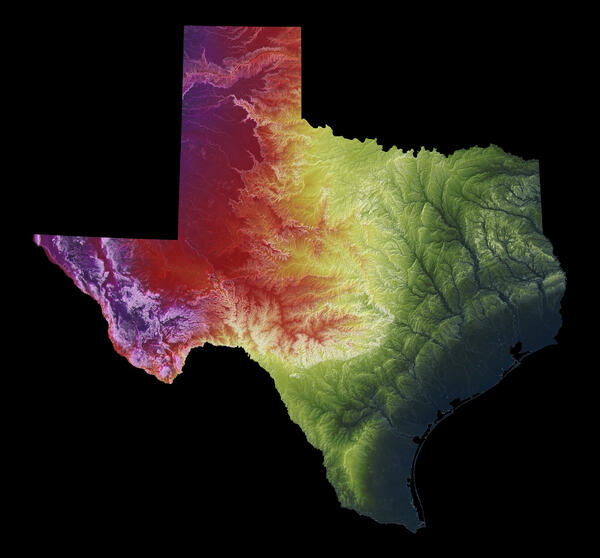
3DEP As Art - Texas
A modern illustration of each state's landscape uses 3DEP data to showcase subtle beauty in their elevation differences like never before. Every state has been consistently adjusted and colorized using the seamless 3DEP 1/3rd arc-second data according to its highest and lowest elevations, which helps accentuate differences even in states with low relief.
A modern illustration of each state's landscape uses 3DEP data to showcase subtle beauty in their elevation differences like never before. Every state has been consistently adjusted and colorized using the seamless 3DEP 1/3rd arc-second data according to its highest and lowest elevations, which helps accentuate differences even in states with low relief.
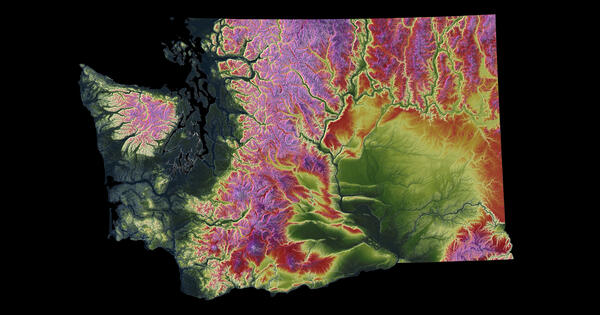
3DEP As Art - Washington
A modern illustration of each state's landscape uses 3DEP data to showcase subtle beauty in their elevation differences like never before. Every state has been consistently adjusted and colorized using the seamless 3DEP 1/3rd arc-second data according to its highest and lowest elevations, which helps accentuate differences even in states with low relief.
A modern illustration of each state's landscape uses 3DEP data to showcase subtle beauty in their elevation differences like never before. Every state has been consistently adjusted and colorized using the seamless 3DEP 1/3rd arc-second data according to its highest and lowest elevations, which helps accentuate differences even in states with low relief.
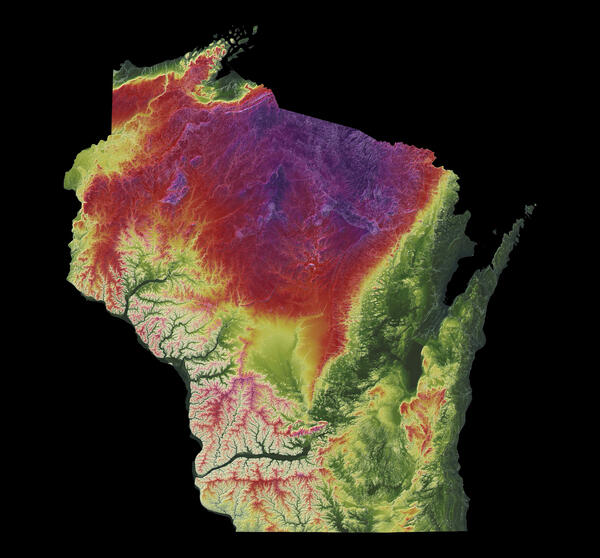
3DEP As Art - Wisconsin
A modern illustration of each state's landscape uses 3DEP data to showcase subtle beauty in their elevation differences like never before. Every state has been consistently adjusted and colorized using the seamless 3DEP 1/3rd arc-second data according to its highest and lowest elevations, which helps accentuate differences even in states with low relief.
A modern illustration of each state's landscape uses 3DEP data to showcase subtle beauty in their elevation differences like never before. Every state has been consistently adjusted and colorized using the seamless 3DEP 1/3rd arc-second data according to its highest and lowest elevations, which helps accentuate differences even in states with low relief.
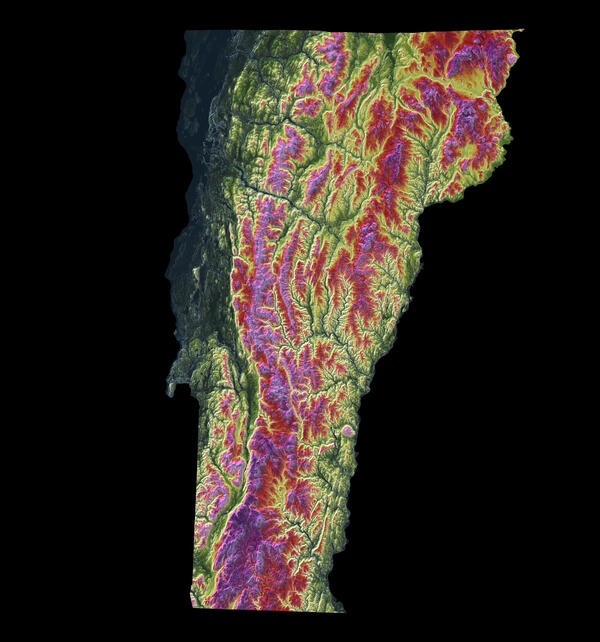
3DEP As Art - Vermont
A modern illustration of each state's landscape uses 3DEP data to showcase subtle beauty in their elevation differences like never before. Every state has been consistently adjusted and colorized using the seamless 3DEP 1/3rd arc-second data according to its highest and lowest elevations, which helps accentuate differences even in states with low relief.
A modern illustration of each state's landscape uses 3DEP data to showcase subtle beauty in their elevation differences like never before. Every state has been consistently adjusted and colorized using the seamless 3DEP 1/3rd arc-second data according to its highest and lowest elevations, which helps accentuate differences even in states with low relief.
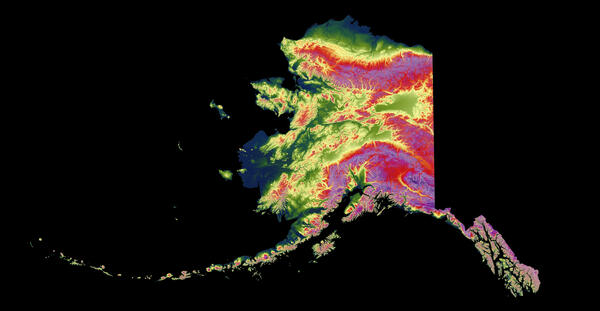
3DEP As Art - Alaska
A modern illustration of each state's landscape uses 3DEP data to showcase subtle beauty in their elevation differences like never before. Every state has been consistently adjusted and colorized using the seamless 3DEP 1/3rd arc-second data according to its highest and lowest elevations, which helps accentuate differences even in states with low relief.
A modern illustration of each state's landscape uses 3DEP data to showcase subtle beauty in their elevation differences like never before. Every state has been consistently adjusted and colorized using the seamless 3DEP 1/3rd arc-second data according to its highest and lowest elevations, which helps accentuate differences even in states with low relief.