
A modern illustration of each state's landscape uses 3DEP data to showcase subtle beauty in their elevation differences like never before. Every state has been consistently adjusted and colorized using the seamless 3DEP 1/3rd arc-second data according to its highest and lowest elevations, which helps accentuate differences even in states with low relief.
Images
The 3DEP Multimedia Gallery is a collection of graphics related to elevation data. All items in this gallery are considered public domain unless otherwise noted.
Filter Total Items: 165
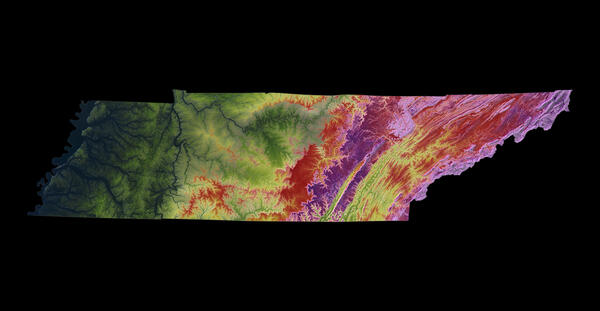
3DEP As Art - Tennessee
A modern illustration of each state's landscape uses 3DEP data to showcase subtle beauty in their elevation differences like never before. Every state has been consistently adjusted and colorized using the seamless 3DEP 1/3rd arc-second data according to its highest and lowest elevations, which helps accentuate differences even in states with low relief.
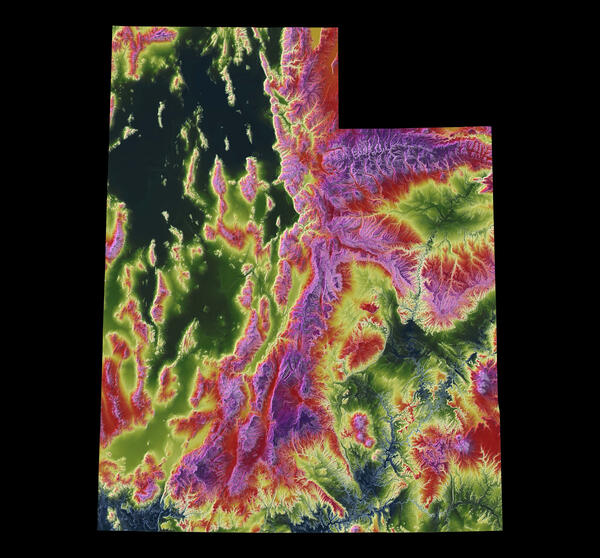
3DEP As Art - Utah
A modern illustration of each state's landscape uses 3DEP data to showcase subtle beauty in their elevation differences like never before. Every state has been consistently adjusted and colorized using the seamless 3DEP 1/3rd arc-second data according to its highest and lowest elevations, which helps accentuate differences even in states with low relief.
A modern illustration of each state's landscape uses 3DEP data to showcase subtle beauty in their elevation differences like never before. Every state has been consistently adjusted and colorized using the seamless 3DEP 1/3rd arc-second data according to its highest and lowest elevations, which helps accentuate differences even in states with low relief.
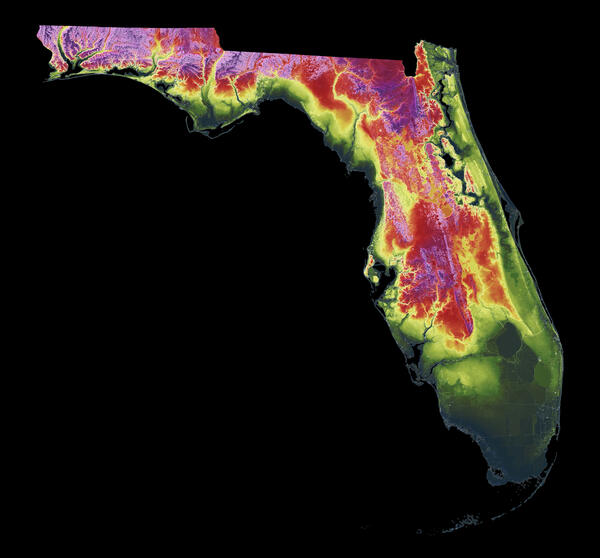
3DEP As Art - Florida
A modern illustration of each state's landscape uses 3DEP data to showcase subtle beauty in their elevation differences like never before. Every state has been consistently adjusted and colorized using the seamless 3DEP 1/3rd arc-second data according to its highest and lowest elevations, which helps accentuate differences even in states with low relief.
A modern illustration of each state's landscape uses 3DEP data to showcase subtle beauty in their elevation differences like never before. Every state has been consistently adjusted and colorized using the seamless 3DEP 1/3rd arc-second data according to its highest and lowest elevations, which helps accentuate differences even in states with low relief.
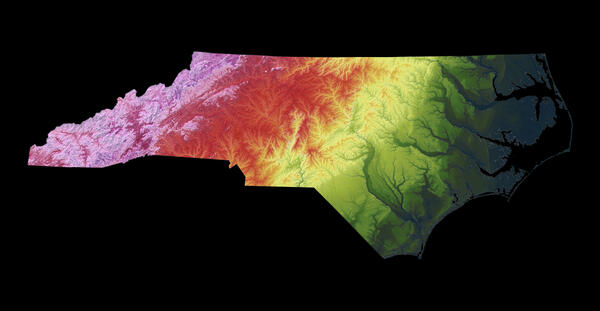
3DEP As Art - North Carolina
A modern illustration of each state's landscape uses 3DEP data to showcase subtle beauty in their elevation differences like never before. Every state has been consistently adjusted and colorized using the seamless 3DEP 1/3rd arc-second data according to its highest and lowest elevations, which helps accentuate differences even in states with low relief.
A modern illustration of each state's landscape uses 3DEP data to showcase subtle beauty in their elevation differences like never before. Every state has been consistently adjusted and colorized using the seamless 3DEP 1/3rd arc-second data according to its highest and lowest elevations, which helps accentuate differences even in states with low relief.
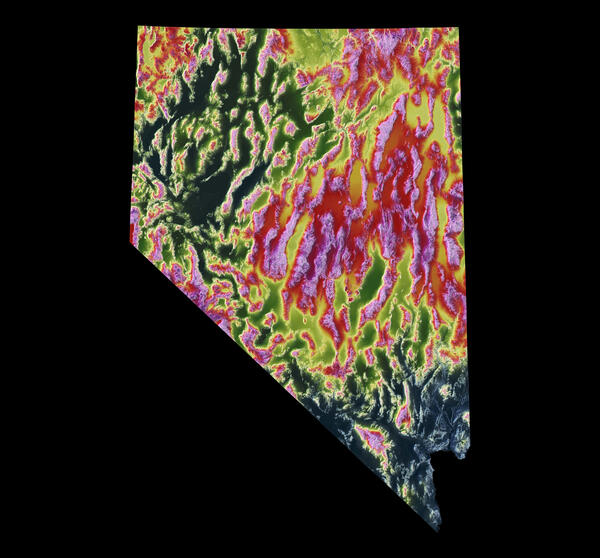
3DEP As Art - Nevada
A modern illustration of each state's landscape uses 3DEP data to showcase subtle beauty in their elevation differences like never before. Every state has been consistently adjusted and colorized using the seamless 3DEP 1/3rd arc-second data according to its highest and lowest elevations, which helps accentuate differences even in states with low relief.
A modern illustration of each state's landscape uses 3DEP data to showcase subtle beauty in their elevation differences like never before. Every state has been consistently adjusted and colorized using the seamless 3DEP 1/3rd arc-second data according to its highest and lowest elevations, which helps accentuate differences even in states with low relief.
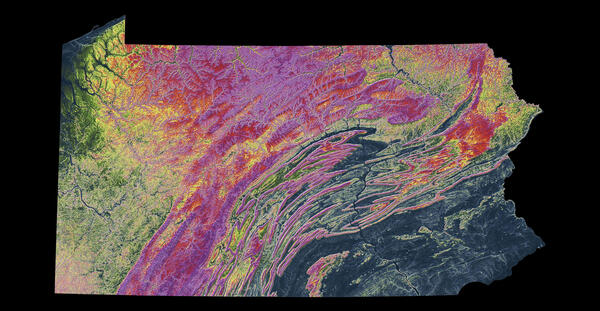
3DEP As Art - Pennsylvania
A modern illustration of each state's landscape uses 3DEP data to showcase subtle beauty in their elevation differences like never before. Every state has been consistently adjusted and colorized using the seamless 3DEP 1/3rd arc-second data according to its highest and lowest elevations, which helps accentuate differences even in states with low relief.
A modern illustration of each state's landscape uses 3DEP data to showcase subtle beauty in their elevation differences like never before. Every state has been consistently adjusted and colorized using the seamless 3DEP 1/3rd arc-second data according to its highest and lowest elevations, which helps accentuate differences even in states with low relief.
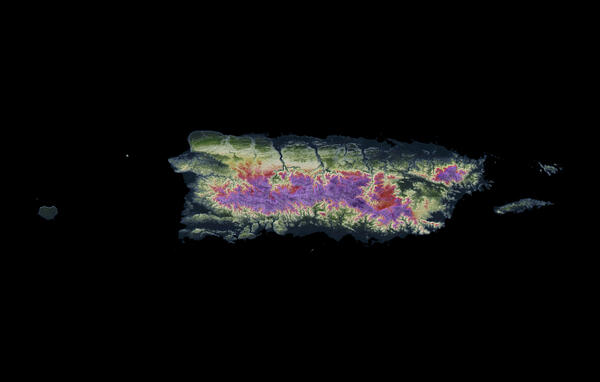
3DEP As Art - Puerto Rico
A modern illustration of each state's landscape uses 3DEP data to showcase subtle beauty in their elevation differences like never before. Every state has been consistently adjusted and colorized using the seamless 3DEP 1/3rd arc-second data according to its highest and lowest elevations, which helps accentuate differences even in states with low relief.
A modern illustration of each state's landscape uses 3DEP data to showcase subtle beauty in their elevation differences like never before. Every state has been consistently adjusted and colorized using the seamless 3DEP 1/3rd arc-second data according to its highest and lowest elevations, which helps accentuate differences even in states with low relief.
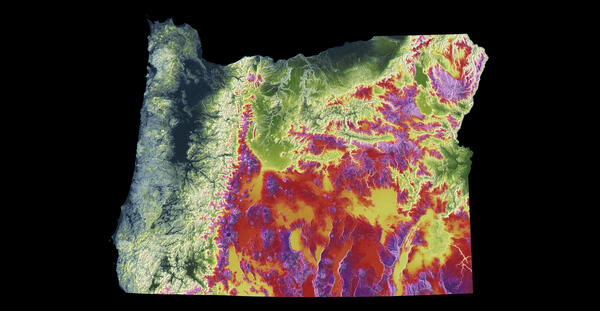
3DEP As Art - Oregon
A modern illustration of each state's landscape uses 3DEP data to showcase subtle beauty in their elevation differences like never before. Every state has been consistently adjusted and colorized using the seamless 3DEP 1/3rd arc-second data according to its highest and lowest elevations, which helps accentuate differences even in states with low relief.
A modern illustration of each state's landscape uses 3DEP data to showcase subtle beauty in their elevation differences like never before. Every state has been consistently adjusted and colorized using the seamless 3DEP 1/3rd arc-second data according to its highest and lowest elevations, which helps accentuate differences even in states with low relief.
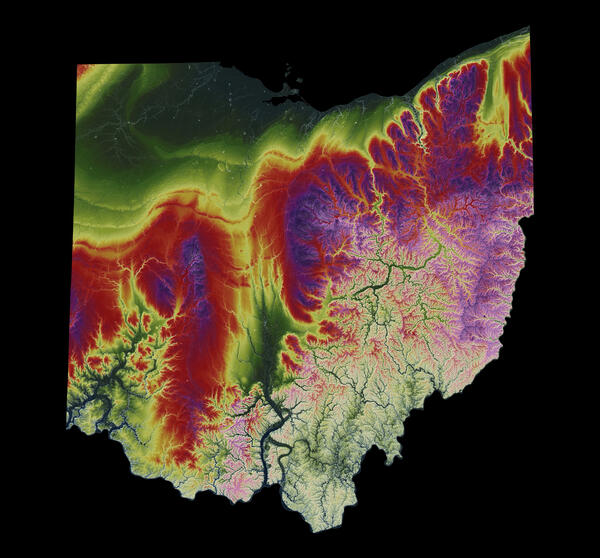
3DEP As Art - Ohio
A modern illustration of each state's landscape uses 3DEP data to showcase subtle beauty in their elevation differences like never before. Every state has been consistently adjusted and colorized using the seamless 3DEP 1/3rd arc-second data according to its highest and lowest elevations, which helps accentuate differences even in states with low relief.
A modern illustration of each state's landscape uses 3DEP data to showcase subtle beauty in their elevation differences like never before. Every state has been consistently adjusted and colorized using the seamless 3DEP 1/3rd arc-second data according to its highest and lowest elevations, which helps accentuate differences even in states with low relief.
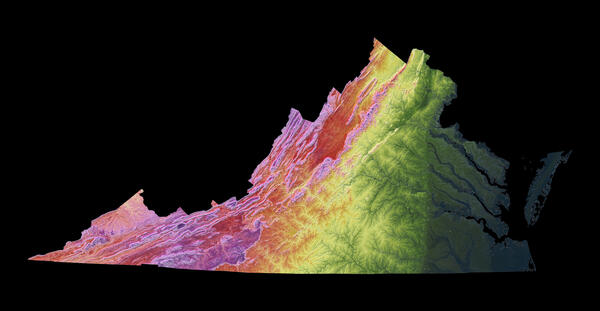
3DEP As Art - Virginia
A modern illustration of each state's landscape uses 3DEP data to showcase subtle beauty in their elevation differences like never before. Every state has been consistently adjusted and colorized using the seamless 3DEP 1/3rd arc-second data according to its highest and lowest elevations, which helps accentuate differences even in states with low relief.
A modern illustration of each state's landscape uses 3DEP data to showcase subtle beauty in their elevation differences like never before. Every state has been consistently adjusted and colorized using the seamless 3DEP 1/3rd arc-second data according to its highest and lowest elevations, which helps accentuate differences even in states with low relief.
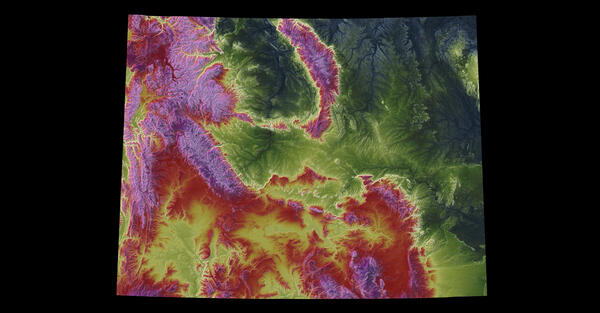
3DEP As Art - Wyoming
A modern illustration of each state's landscape uses 3DEP data to showcase subtle beauty in their elevation differences like never before. Every state has been consistently adjusted and colorized using the seamless 3DEP 1/3rd arc-second data according to its highest and lowest elevations, which helps accentuate differences even in states with low relief.
A modern illustration of each state's landscape uses 3DEP data to showcase subtle beauty in their elevation differences like never before. Every state has been consistently adjusted and colorized using the seamless 3DEP 1/3rd arc-second data according to its highest and lowest elevations, which helps accentuate differences even in states with low relief.
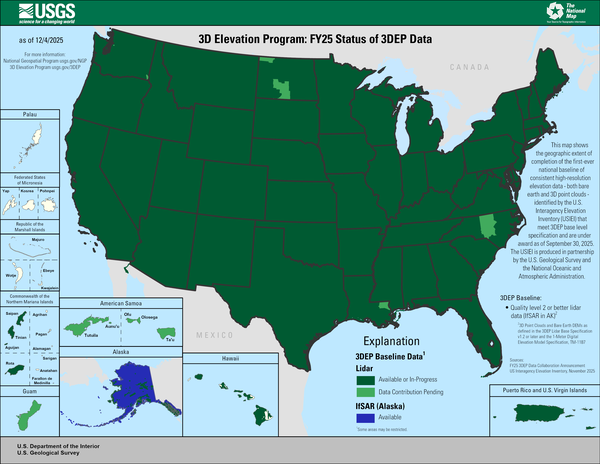
FY25 Status of 3DEP Quality Data
This map of the United States and its territories shows the areal extent and quality level of planned, in-progress, and existing publicly available lidar (IfSAR in Alaska) data identified by the United States Interagency Elevation Inventory (USIEI) that meet 3DEP base level specification planned to be under award by September 30, 2025. 3DEP base level spec
This map of the United States and its territories shows the areal extent and quality level of planned, in-progress, and existing publicly available lidar (IfSAR in Alaska) data identified by the United States Interagency Elevation Inventory (USIEI) that meet 3DEP base level specification planned to be under award by September 30, 2025. 3DEP base level spec
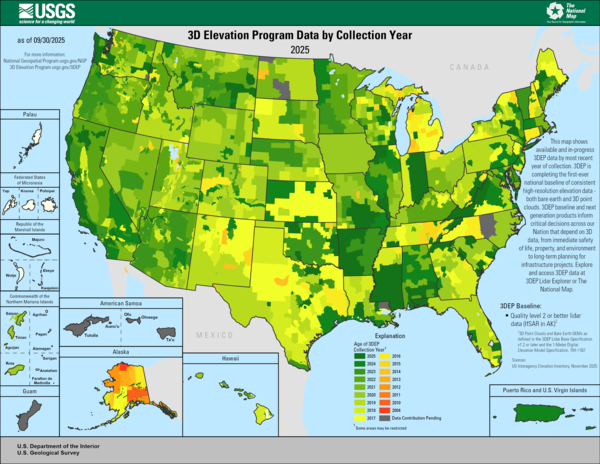
3DEP Quality Data by Collection Year
Map shows geographic extent of completion of the first-ever national baseline of consistent high-resolution elevation data - both bare earth and 3D point clouds.
Map shows geographic extent of completion of the first-ever national baseline of consistent high-resolution elevation data - both bare earth and 3D point clouds.
3DEP Quality Data by Collection Year Animated GIF
This animated GIF is a map of the United States and its territories shows geographic extent of planned, existing, and in-progress 3DEP data acquisition projects by year.
This animated GIF is a map of the United States and its territories shows geographic extent of planned, existing, and in-progress 3DEP data acquisition projects by year.
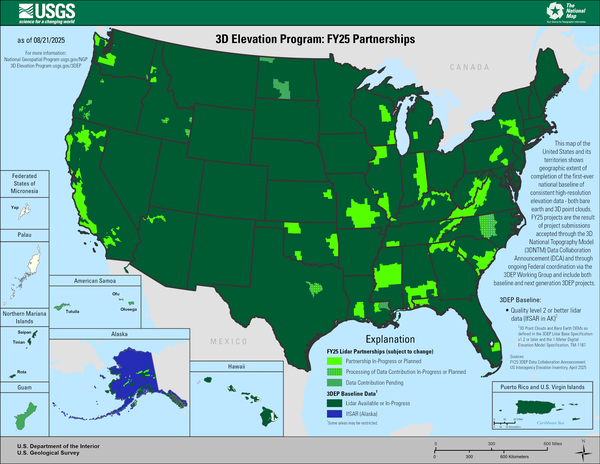
3D Elevation Program FY25 Partnerships
This map of the United States and its territories shows geographic extent of completion of the first-ever national baseline of consistent high-resolution elevation data - both bare earth and 3D point clouds.
This map of the United States and its territories shows geographic extent of completion of the first-ever national baseline of consistent high-resolution elevation data - both bare earth and 3D point clouds.
CONUS Elevation and Hydrography Animation
CONUS elevation map in bright, vibrant colors with purple as highest elevation and blue as lowest elevation and the hydrography map with larger annual flow volumes as thicker lines.
CONUS elevation map in bright, vibrant colors with purple as highest elevation and blue as lowest elevation and the hydrography map with larger annual flow volumes as thicker lines.

Postfire Modified Hillshade over the Eaton Fire
A modified hillshade of a postfire lidar-derived digital surface model over a portion of the Eaton wildfire
A modified hillshade of a postfire lidar-derived digital surface model over a portion of the Eaton wildfire

A Modified Hillshade over the Pallisades Fire
A modified hillshade rendering from lidar-derived DSM data over part of the Pallisades Fire
A modified hillshade rendering from lidar-derived DSM data over part of the Pallisades Fire

Eaton Fire DSM Hillshade
A modified hillshade rendering from lidar-derived DSM data over par of the Eaton Fire
A modified hillshade rendering from lidar-derived DSM data over par of the Eaton Fire

A Modified Hillshade over the Pallisades Fire
A modified hillshade rendering from lidar-derived DSM data over the Pallisades Fire
A modified hillshade rendering from lidar-derived DSM data over the Pallisades Fire

Modified Hillshade of Pallisades Fire
A modified hillshade rendering from lidar-derived DSM data over the Pallisades Fire
A modified hillshade rendering from lidar-derived DSM data over the Pallisades Fire