
Sea Ice Present, Future and Ice Loss and Wildlife
Return to Ecosystems >> Marine Ecosystems or Terrestrial Ecosystems >> Habitat Dynamics
Sea Ice, Present

Over the past three decades, the extent of Arctic sea ice has diminished significantly in all months of the year. The greatest losses have occurred in summer. Sea ice extent in the Arctic Ocean in September 2012 was less than half the average September extent during the 1980s.
Several factors have synergistically contributed to the rapid decline of sea ice in the Arctic:
* Global warming caused by greenhouse gas emissions1
* Increased in-flow of warm ocean water from the Atlantic2 and the Pacific3
* Increased wind-driven export of older, thicker ice from the Arctic basin into the Atlantic4
* Positive feedback from darker surfaces absorbing more solar energy5
Ecologically, sea ice sustains a unique food web in the Arctic and provides essential habitat for several Department of Interior trust species, including polar bears, walruses, and eiders. Recent losses of sea ice habitat raise concerns for these species.
Key Findings
Sea ice that has survived one or more summer melt seasons is called multiyear (or perennial) ice. Abundance of multiyear ice in the Arctic is declining.
Belchansky, G. I., D. C. Douglas, V. A. Eremeev, and N. G. Platonov. 2005. Variations in the Arctic's multiyear sea ice cover: A neural network analysis of SMMR-SSM/I data, 1979-2004. Geophysical Resource Letter 32(9):L09605. doi:10.1029/2005GL022395
Belchansky, G. I., D. C. Douglas, I. V. Alpatsky, and N. G. Platonov. 2004. Spatial and temporal multiyear sea ice distributions in the Arctic: A neural network analysis of SSM/I data, 1988-2001. Journal of Geophysical Research 109:C10017. doi:10.1029/2004JC002388
The Arctic melt season is starting earlier and ending later over both the ocean (sea ice) and the land (snow cover).
Stone, R. S., D. C. Douglas, G. I. Belchansky, and S. D. Drobot. 2005. Correlated declines in Pacific arctic snow and sea ice cover. Arctic Research of the United States 19(1):18-25. [Full Publication]
Belchansky, G. I., D. C. Douglas, I. N. Mordvintsev, and N. G. Platonov. 2004. Estimating the time of melt onset and freeze onset over Arctic sea-ice area using active and passive microwave data. Remote Sensing of Environment 92:21-39. doi:10.1016/j.rse.2004.05.001
Belchansky, G. I., D. C. Douglas, and N. G. Platonov. 2004. Duration of the Arctic sea ice melt season: Regional and interannual variability, 1979-2001. Journal of Climate 17(1):67-80. doi:10.1175/1520-0442(2004)017<0067:DOTASI>2.0.CO;2
The Arctic ice pack has become younger and thinner, making it more vulnerable to the summer melt season.
Belchansky, G. I., D. C. Douglas, and N. G. Platonov. 2008. Fluctuating Arctic sea ice thickness changes estimated by an in-situ learned and empirically forced neural network model. Journal of Climate 21(4):716-729. doi:10.1175/2007JCLI1787.1
Belchansky, G. I., D. C. Douglas, and N. G. Platonov. 2005. Spatial and temporal variations in the age structure of Arctic sea ice. Geophysical Resource Letter 32:L18504. doi:10.1029/2005GL023976
References
1 IPCC Fifth Assessment Report, The Physical Science Basis, Summary for Policy Makers, Section D.3
2 Polyakov et al. 2010, Arctic Ocean warming contributes to reduced polar ice cap, J. Phys. Oceanogr.
3 Woodgate et al. 2012, Observed increases in Bering Strait oceanic fluxes from the Pacific, Geophys. Res. Lett.
4 NOAA, Very little old sea ice remains in the Arctic (digital animation)
5 Serreze and Barry 2011, Processes and impacts of Arctic amplification: A research synthesis, Global Planetary Change
External sites (with near-real-time ice monitoring and analysis)
- Arctic Sea Ice News, National Snow and Ice Data Center
- Ice Analysis Products, National Ice Center
- The Cryosphere Today, University of Illinois Urbana
- Arctic Sea-ice Monitor, International Arctic Research Center
- Daily AMSR2 Sea Ice Maps, University of Bremen
Sea Ice, Future
Future status of Arctic sea ice is highly dependent on future levels of greenhouse gas emissions
The figure below shows monthly maps of sea ice extent for the last decade of the 21st century as projected by general circulation models (GCMs). Each row in the figure shows future ice conditions based on a different level (scenario) of future greenhouse gas emissions, termed a representative concentration pathway (RCP). The maps are centered on the North Pole with the north Atlantic Ocean at the bottom.
Note the striking differences in how much (and for how long) sea ice is projected to melt during summer by century’s end if greenhouse gas emissions are promptly and aggressively mitigated (top row, RCP2.6), prudently addressed in the coming decades (middle row, RCP4.5), or left unabated at present rates of increase (bottom row, RCP8.5).

The maps above depict median sea ice extent among 5 GCMs identified by Massonnet et al. (2012) on the basis of their ability to simulate recent observations in September sea ice extent, amplitude of the seasonal cycle, annual average sea ice volume, and trend in September ice extent. The 5 selected models were ACCESS1.0, ACCESS1.3, GFDL-CM3, IPSL-CM5A-MR, and MPI-ESM-MR. Raw data were obtained from the Coupled Model Intercomparison Project Phase 5 (CMIP5). The native grid for each model was remapped to a polar stereographic projection and resampled (nearest neighbor) to 25-km pixel resolution. For each of 10 years (2091-2100) and 5 models (50 model-ice-years total), median ice extent was classified for any pixel in which >25 model-ice-years had ice concentration >15%. Only 3 models had CMIP5 outputs for RCP2.6 (GFDL-CM3, IPSL-CM5A-MR, and MPI-ESM-MR, so the threshold for median extent was >15 model-ice-years.

(above) Figure 12.31e from the IPCC’s Fifth Reporting Period (Collins et al. 2013, Chapter 12). The figure shows time series of September Arctic sea ice extent (5-year running mean) as projected by all CMIP5 models and their ensemble members under RCP8.5 (thin gray curves). The thick, colored curves correspond to the subset of 5 CMIP5 models (one member each) that were selected by Massonnet et al. (2012) on the basis of their ability to simulate recent sea ice observations. Outputs from these 5 models were used to create the monthly median ice cover maps above.
GHG emission pathways
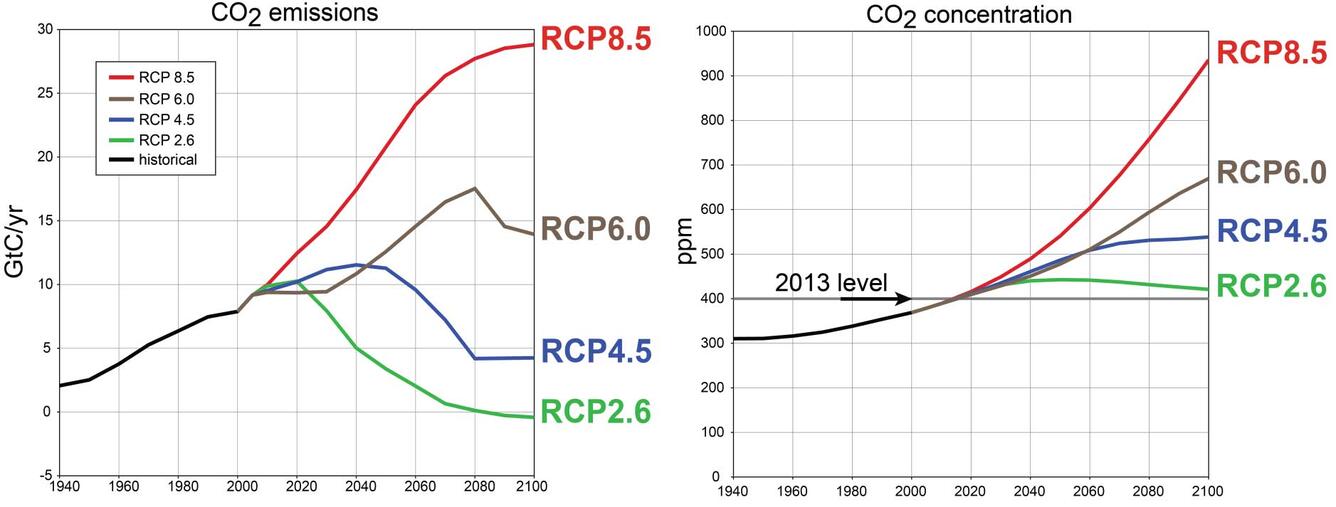
Four RCPs are analyzed in the IPCC’s Fifth Reporting Period, and they cover a broad range of possible emissions pathways. The RCPs are named by the amount of added net radiative forcing (Watts/m2) attained by the end of the century. In the RCP2.6 pathway, GHG emissions drop to zero by about 2080, and become slightly negative thereafter. This pathway keeps global temperature rise below 2°C by century’s end and adverts what some have called “dangerous climate change”. The RCP2.6 pathway would require prompt and aggressive mitigation measures. In stark contrast, the RCP8.5 pathway extrapolates observed accelerating levels of GHG emissions throughout the century and beyond. Attaining such high levels of emissions would require a high dependence on, and high availability of, hydrocarbon fuels, and would likely be accompanied by a plethora of undesirable socioeconomic and ecological changes. The RCP 4.5 pathway entails prudent attention to curbing and reducing GHG emissions in the coming decades, most likely attained through a combination of technological developments and mitigation measures.
Uncertainties

Not only are there uncertainties about how promptly and aggressively governments, industries, and citizens worldwide will address future GHG emission levels, there are uncertainties (differences) among projections of future climate by different models. The median ice extent maps (shown above) obscure the spread of outcomes among the different underlying models. That range (model spread) is illustrated by the shaded regions in this figure, adapted from Figure SPM.7b of the 2013 IPCC Working Group I, Summary for Policymakers. The multi-model September mean (line) and range (shaded) are shown for the model ensemble selected by Massonnet et al. (2013) under RCP8.5 forcing (red, n=5 models) and RCP2.6 forcing (blue, n=3 models). Also shown are model hindcasts based on simulated 20th-century forcing (gray), as well as the observed record of sea ice extent from satellite observations (yellow line).
Key Findings
If global greenhouse gas emissions continue rising at unabated levels, by the end of the century sea ice will be so diminished that all of the summertime walrus and polar bear offshore habitat could disappear from the Chukchi Sea for several months.
Douglas, D. C. 2010. Arctic sea ice decline: Projected changes in timing and extent of sea ice in the Bering and Chukchi seas. USGS Open-File Report 2010-1176, 32 p. [Full Publication]
Ice Loss and Wildlife

Sea ice provides habitat for many species of wildlife, including polar bears, walruses, seals, and eiders. Characteristics of the sea ice change daily as it drifts with the wind and ocean currents, and seasonally as it melts and freezes. Many studies at the USGS Alaska Science Center have investigated relationships between sea ice and the distribution, abundance, and health of wildlife species. Owing to dramatic losses of Arctic sea ice during the past two decades, the implications to wildlife are key topics of study in the Alaska Science Center’s Changing Arctic Ecosystems Initiative.
Key findings
If global greenhouse gas emissions continue rising at unabated levels, by the end of the century sea ice will be so diminished that polar bears could be extirpated from much of their range, and walrus populations reduced in size and distribution. Mitigating greenhouse gas emissions can help lessen the severity of impacts on ice-dependent animals.
Atwood, T. C., B. G. Marcot, D. C. Douglas, S. C. Amstrup, K. D. Rode, G. M. Durner, and J. F. Bromaghin. 2015. Evaluating and ranking threats to the long-term persistence of polar bears. USGS Open-File Report 2014-1254, 114 p. doi:10.3133/ofr20141254
Jay, C. V., B. G. Marcot, and D. C. Douglas. 2011. Projected status of the Pacific walrus (Odobenus rosmarus divergens) in the twenty-first century. Polar Biology 34(7):1065-1084. doi:10.1007/s00300-011-0967-4
Amstrup, S. C., E. T. DeWeaver, D. C. Douglas, B. G. Marcot, G. M. Durner, C. M. Bitz, and D. A. Bailey. 2010. Greenhouse gas mitigation can reduce sea-ice loss and increase polar bear persistence. Nature 468:955-958. doi:10.1038/nature09653
Amstrup, S. C., H. Caswell, E. T. DeWeaver, I. Stirling, D. C. Douglas, B. G. Marcot, and C. M. Hunter. 2009. Rebuttal of "Polar bear population forecasts: A public-policy forecasting audit". Interfaces 39(4):353-369. doi:10.1287/inte.1090.0444
Durner, G. M., D. C. Douglas, R. M. Nielson, S. C. Amstrup, T. L. McDonald, I. Stirling, M. Mauritzen, E. W. Born, Ø. Wiig, E. T. DeWeaver, M. C. Serreze, S. E. Belikov, M. M. Holland, J. Maslanik, J. Aars, D. A. Bailey, and A. E. Derocher. 2009. Predicting 21st-century polar bear habitat distribution from global climate models. Ecological Monographs 79(1):25-58. doi:10.1890/07-2089.1
Amstrup, S. C., B. G. Marcot, and D. C. Douglas. 2008. A Bayesian network modeling approach to forecasting the 21st century worldwide status of polar bears. Pages 213-268 in Eric. T. DeWeaver, Cecilia M. Bitz, and L.-Bruno Tremblay (eds.). Arctic Sea Ice Decline: Observations, Projections, Mechanisms, and Implications. Geophysical Monograph Series 180. [Full Publication]
Availability and quality of sea ice habitat can influence the body condition of polar bears, as well as their denning distribution and population dynamics.
Bromaghin, J. F., T. L. McDonald, I. Stirling, A. E. Derocher, E. S. Richardson, E. V. Regehr, D. C. Douglas, G. M. Durner, T. C. Atwood, and S. C. Amstrup. 2015. Polar bear population dynamics in the southern Beaufort Sea during a period of sea ice decline. Ecological Applications 25(3):634-651. doi:10.1890/14-1129.1
Rode, K. D., E. V. Regehr, D. C. Douglas, G. M. Durner, A. E. Derocher, G. W. Thiemann, and S. M. Budge. 2014. Variation in the response of an Arctic top predator experiencing habitat loss: feeding and reproductive ecology of two polar bear populations. Global Change Biology 20(1):76-88. doi:10.1111/gcb.12339
Fischbach, A. S., S. C. Amstrup, and D. C. Douglas. 2007. Landward and eastward shift of Alaskan polar bears denning associated with recent sea ice changes. Polar Biology 30:1395-1405. doi:10.1007/s00300-007-0300-4
Spectacled and Common Eiders winter in the Bering Sea ice pack, occupying small areas of open water where they can dive for food. They must negotiate the dynamics of ice drift and freeze-thaw in order to find and utilize suitable places to forage and rest.
Petersen, M. R., D. C. Douglas, H. M. Wilson, and S. E. McCloskey. 2012. Effects of sea ice on winter site fidelity of Pacific Common Eiders (Somateria mollissima v-nigrum). The Auk 129(3):399-408. doi:10.1525/auk.2012.11256
Petersen, M. R. and D. C. Douglas. 2004. Winter ecology of spectacled eiders: Environmental characteristics and population change. Condor 106:79-94. doi:10.1650/7292
Below are other science projects associated with this project.

Habitat Dynamics

Wind - Habitat Dynamics

Sea Ice Present, Future and Ice Loss and Wildlife
Return to Ecosystems >> Marine Ecosystems or Terrestrial Ecosystems >> Habitat Dynamics
Sea Ice, Present
Over the past three decades, the extent of Arctic sea ice has diminished significantly in all months of the year. The greatest losses have occurred in summer. Sea ice extent in the Arctic Ocean in September 2012 was less than half the average September extent during the 1980s.
Several factors have synergistically contributed to the rapid decline of sea ice in the Arctic:
* Global warming caused by greenhouse gas emissions1
* Increased in-flow of warm ocean water from the Atlantic2 and the Pacific3
* Increased wind-driven export of older, thicker ice from the Arctic basin into the Atlantic4
* Positive feedback from darker surfaces absorbing more solar energy5
Ecologically, sea ice sustains a unique food web in the Arctic and provides essential habitat for several Department of Interior trust species, including polar bears, walruses, and eiders. Recent losses of sea ice habitat raise concerns for these species.
Key Findings
Sea ice that has survived one or more summer melt seasons is called multiyear (or perennial) ice. Abundance of multiyear ice in the Arctic is declining.
Belchansky, G. I., D. C. Douglas, V. A. Eremeev, and N. G. Platonov. 2005. Variations in the Arctic's multiyear sea ice cover: A neural network analysis of SMMR-SSM/I data, 1979-2004. Geophysical Resource Letter 32(9):L09605. doi:10.1029/2005GL022395
Belchansky, G. I., D. C. Douglas, I. V. Alpatsky, and N. G. Platonov. 2004. Spatial and temporal multiyear sea ice distributions in the Arctic: A neural network analysis of SSM/I data, 1988-2001. Journal of Geophysical Research 109:C10017. doi:10.1029/2004JC002388
The Arctic melt season is starting earlier and ending later over both the ocean (sea ice) and the land (snow cover).
Stone, R. S., D. C. Douglas, G. I. Belchansky, and S. D. Drobot. 2005. Correlated declines in Pacific arctic snow and sea ice cover. Arctic Research of the United States 19(1):18-25. [Full Publication]
Belchansky, G. I., D. C. Douglas, I. N. Mordvintsev, and N. G. Platonov. 2004. Estimating the time of melt onset and freeze onset over Arctic sea-ice area using active and passive microwave data. Remote Sensing of Environment 92:21-39. doi:10.1016/j.rse.2004.05.001
Belchansky, G. I., D. C. Douglas, and N. G. Platonov. 2004. Duration of the Arctic sea ice melt season: Regional and interannual variability, 1979-2001. Journal of Climate 17(1):67-80. doi:10.1175/1520-0442(2004)017<0067:DOTASI>2.0.CO;2
The Arctic ice pack has become younger and thinner, making it more vulnerable to the summer melt season.
Belchansky, G. I., D. C. Douglas, and N. G. Platonov. 2008. Fluctuating Arctic sea ice thickness changes estimated by an in-situ learned and empirically forced neural network model. Journal of Climate 21(4):716-729. doi:10.1175/2007JCLI1787.1
Belchansky, G. I., D. C. Douglas, and N. G. Platonov. 2005. Spatial and temporal variations in the age structure of Arctic sea ice. Geophysical Resource Letter 32:L18504. doi:10.1029/2005GL023976
References
1 IPCC Fifth Assessment Report, The Physical Science Basis, Summary for Policy Makers, Section D.3
2 Polyakov et al. 2010, Arctic Ocean warming contributes to reduced polar ice cap, J. Phys. Oceanogr.
3 Woodgate et al. 2012, Observed increases in Bering Strait oceanic fluxes from the Pacific, Geophys. Res. Lett.
4 NOAA, Very little old sea ice remains in the Arctic (digital animation)
5 Serreze and Barry 2011, Processes and impacts of Arctic amplification: A research synthesis, Global Planetary Change
External sites (with near-real-time ice monitoring and analysis)
- Arctic Sea Ice News, National Snow and Ice Data Center
- Ice Analysis Products, National Ice Center
- The Cryosphere Today, University of Illinois Urbana
- Arctic Sea-ice Monitor, International Arctic Research Center
- Daily AMSR2 Sea Ice Maps, University of Bremen
Sea Ice, Future
Future status of Arctic sea ice is highly dependent on future levels of greenhouse gas emissions
The figure below shows monthly maps of sea ice extent for the last decade of the 21st century as projected by general circulation models (GCMs). Each row in the figure shows future ice conditions based on a different level (scenario) of future greenhouse gas emissions, termed a representative concentration pathway (RCP). The maps are centered on the North Pole with the north Atlantic Ocean at the bottom.
Note the striking differences in how much (and for how long) sea ice is projected to melt during summer by century’s end if greenhouse gas emissions are promptly and aggressively mitigated (top row, RCP2.6), prudently addressed in the coming decades (middle row, RCP4.5), or left unabated at present rates of increase (bottom row, RCP8.5).
The maps above depict median sea ice extent among 5 GCMs identified by Massonnet et al. (2012) on the basis of their ability to simulate recent observations in September sea ice extent, amplitude of the seasonal cycle, annual average sea ice volume, and trend in September ice extent. The 5 selected models were ACCESS1.0, ACCESS1.3, GFDL-CM3, IPSL-CM5A-MR, and MPI-ESM-MR. Raw data were obtained from the Coupled Model Intercomparison Project Phase 5 (CMIP5). The native grid for each model was remapped to a polar stereographic projection and resampled (nearest neighbor) to 25-km pixel resolution. For each of 10 years (2091-2100) and 5 models (50 model-ice-years total), median ice extent was classified for any pixel in which >25 model-ice-years had ice concentration >15%. Only 3 models had CMIP5 outputs for RCP2.6 (GFDL-CM3, IPSL-CM5A-MR, and MPI-ESM-MR, so the threshold for median extent was >15 model-ice-years.
(above) Figure 12.31e from the IPCC’s Fifth Reporting Period (Collins et al. 2013, Chapter 12). The figure shows time series of September Arctic sea ice extent (5-year running mean) as projected by all CMIP5 models and their ensemble members under RCP8.5 (thin gray curves). The thick, colored curves correspond to the subset of 5 CMIP5 models (one member each) that were selected by Massonnet et al. (2012) on the basis of their ability to simulate recent sea ice observations. Outputs from these 5 models were used to create the monthly median ice cover maps above.
GHG emission pathways
Four RCPs are analyzed in the IPCC’s Fifth Reporting Period, and they cover a broad range of possible emissions pathways. The RCPs are named by the amount of added net radiative forcing (Watts/m2) attained by the end of the century. In the RCP2.6 pathway, GHG emissions drop to zero by about 2080, and become slightly negative thereafter. This pathway keeps global temperature rise below 2°C by century’s end and adverts what some have called “dangerous climate change”. The RCP2.6 pathway would require prompt and aggressive mitigation measures. In stark contrast, the RCP8.5 pathway extrapolates observed accelerating levels of GHG emissions throughout the century and beyond. Attaining such high levels of emissions would require a high dependence on, and high availability of, hydrocarbon fuels, and would likely be accompanied by a plethora of undesirable socioeconomic and ecological changes. The RCP 4.5 pathway entails prudent attention to curbing and reducing GHG emissions in the coming decades, most likely attained through a combination of technological developments and mitigation measures.
Uncertainties
Not only are there uncertainties about how promptly and aggressively governments, industries, and citizens worldwide will address future GHG emission levels, there are uncertainties (differences) among projections of future climate by different models. The median ice extent maps (shown above) obscure the spread of outcomes among the different underlying models. That range (model spread) is illustrated by the shaded regions in this figure, adapted from Figure SPM.7b of the 2013 IPCC Working Group I, Summary for Policymakers. The multi-model September mean (line) and range (shaded) are shown for the model ensemble selected by Massonnet et al. (2013) under RCP8.5 forcing (red, n=5 models) and RCP2.6 forcing (blue, n=3 models). Also shown are model hindcasts based on simulated 20th-century forcing (gray), as well as the observed record of sea ice extent from satellite observations (yellow line).
Key Findings
If global greenhouse gas emissions continue rising at unabated levels, by the end of the century sea ice will be so diminished that all of the summertime walrus and polar bear offshore habitat could disappear from the Chukchi Sea for several months.
Douglas, D. C. 2010. Arctic sea ice decline: Projected changes in timing and extent of sea ice in the Bering and Chukchi seas. USGS Open-File Report 2010-1176, 32 p. [Full Publication]
Ice Loss and Wildlife
Sea ice provides habitat for many species of wildlife, including polar bears, walruses, seals, and eiders. Characteristics of the sea ice change daily as it drifts with the wind and ocean currents, and seasonally as it melts and freezes. Many studies at the USGS Alaska Science Center have investigated relationships between sea ice and the distribution, abundance, and health of wildlife species. Owing to dramatic losses of Arctic sea ice during the past two decades, the implications to wildlife are key topics of study in the Alaska Science Center’s Changing Arctic Ecosystems Initiative.
Key findings
If global greenhouse gas emissions continue rising at unabated levels, by the end of the century sea ice will be so diminished that polar bears could be extirpated from much of their range, and walrus populations reduced in size and distribution. Mitigating greenhouse gas emissions can help lessen the severity of impacts on ice-dependent animals.
Atwood, T. C., B. G. Marcot, D. C. Douglas, S. C. Amstrup, K. D. Rode, G. M. Durner, and J. F. Bromaghin. 2015. Evaluating and ranking threats to the long-term persistence of polar bears. USGS Open-File Report 2014-1254, 114 p. doi:10.3133/ofr20141254
Jay, C. V., B. G. Marcot, and D. C. Douglas. 2011. Projected status of the Pacific walrus (Odobenus rosmarus divergens) in the twenty-first century. Polar Biology 34(7):1065-1084. doi:10.1007/s00300-011-0967-4
Amstrup, S. C., E. T. DeWeaver, D. C. Douglas, B. G. Marcot, G. M. Durner, C. M. Bitz, and D. A. Bailey. 2010. Greenhouse gas mitigation can reduce sea-ice loss and increase polar bear persistence. Nature 468:955-958. doi:10.1038/nature09653
Amstrup, S. C., H. Caswell, E. T. DeWeaver, I. Stirling, D. C. Douglas, B. G. Marcot, and C. M. Hunter. 2009. Rebuttal of "Polar bear population forecasts: A public-policy forecasting audit". Interfaces 39(4):353-369. doi:10.1287/inte.1090.0444
Durner, G. M., D. C. Douglas, R. M. Nielson, S. C. Amstrup, T. L. McDonald, I. Stirling, M. Mauritzen, E. W. Born, Ø. Wiig, E. T. DeWeaver, M. C. Serreze, S. E. Belikov, M. M. Holland, J. Maslanik, J. Aars, D. A. Bailey, and A. E. Derocher. 2009. Predicting 21st-century polar bear habitat distribution from global climate models. Ecological Monographs 79(1):25-58. doi:10.1890/07-2089.1
Amstrup, S. C., B. G. Marcot, and D. C. Douglas. 2008. A Bayesian network modeling approach to forecasting the 21st century worldwide status of polar bears. Pages 213-268 in Eric. T. DeWeaver, Cecilia M. Bitz, and L.-Bruno Tremblay (eds.). Arctic Sea Ice Decline: Observations, Projections, Mechanisms, and Implications. Geophysical Monograph Series 180. [Full Publication]
Availability and quality of sea ice habitat can influence the body condition of polar bears, as well as their denning distribution and population dynamics.
Bromaghin, J. F., T. L. McDonald, I. Stirling, A. E. Derocher, E. S. Richardson, E. V. Regehr, D. C. Douglas, G. M. Durner, T. C. Atwood, and S. C. Amstrup. 2015. Polar bear population dynamics in the southern Beaufort Sea during a period of sea ice decline. Ecological Applications 25(3):634-651. doi:10.1890/14-1129.1
Rode, K. D., E. V. Regehr, D. C. Douglas, G. M. Durner, A. E. Derocher, G. W. Thiemann, and S. M. Budge. 2014. Variation in the response of an Arctic top predator experiencing habitat loss: feeding and reproductive ecology of two polar bear populations. Global Change Biology 20(1):76-88. doi:10.1111/gcb.12339
Fischbach, A. S., S. C. Amstrup, and D. C. Douglas. 2007. Landward and eastward shift of Alaskan polar bears denning associated with recent sea ice changes. Polar Biology 30:1395-1405. doi:10.1007/s00300-007-0300-4
Spectacled and Common Eiders winter in the Bering Sea ice pack, occupying small areas of open water where they can dive for food. They must negotiate the dynamics of ice drift and freeze-thaw in order to find and utilize suitable places to forage and rest.
Petersen, M. R., D. C. Douglas, H. M. Wilson, and S. E. McCloskey. 2012. Effects of sea ice on winter site fidelity of Pacific Common Eiders (Somateria mollissima v-nigrum). The Auk 129(3):399-408. doi:10.1525/auk.2012.11256
Petersen, M. R. and D. C. Douglas. 2004. Winter ecology of spectacled eiders: Environmental characteristics and population change. Condor 106:79-94. doi:10.1650/7292
Below are other science projects associated with this project.