
Tropical Storm Irene in New England, 2011
Tropical Storm Irene arrived in New England on August 28, 2011, bringing extreme winds, rapidly changing pressure, and record-setting rainfall to the region. Over the next 18 hours, the resulting coastal flooding and historic riverine flooding resulted in damages estimated to be in excess of $7 billion and approximately 45 deaths (Suro and others, 2015).
The U.S. Geological Survey (USGS) was actively involved in preparing for and assisting with the long-term recovery from this historic flood. This story examines the impact of Tropical Storm Irene and the role of USGS monitoring and science in identifying, understanding, and mitigating flood risks.
Introduction
Landfall
Storm Surge
Inland Flooding
Sediment Transport
Monitoring the Flood
Hydrologic Monitoring Network
High Water Marks
Planning for the Future
Flood Hardening
References
Acknowledgements
Introduction
Hurricane Irene formed in the Caribbean off of Puerto Rico on August 22, 2011, reaching a maximum of category 3 on August 24th, before making first landfall on August 27th in North Carolina. The storm continued just offshore, up the Eastern coast of the United States before making second landfall near Little Egg Inlet, New Jersey where it was downgraded to a tropical storm (Lahiff, 2015). On August 28th, Tropical Storm Irene made its way into Connecticut and continued northward through New England with the eye of the storm tracking almost directly up the Connecticut River Valley.
The Tropical Storm combined with an astronomical high tide, due to the new moon phase, in Long Island Sound caused a destructive storm surge along the coast. As the storm moved inland, most areas in western Massachusetts and Vermont would receive 3-8 inches of rain in the 18 hours it took the storm to pass through the area. Some areas received more than 10 inches of rain, which contributed to the wettest August records for New Hampshire and Vermont, and the 2nd wettest on record for Connecticut, Maine, and Massachusetts (Northeast Regional Climate Center, 2021). Two days before Tropical Storm Irene hit New England, streamflows at 100% of the streamgage network were at or above normal conditions, with 47% of the streamflow in the network at the 90th percentile or higher. This, combined with the intense precipitation during the storm event brought about drastic flooding.
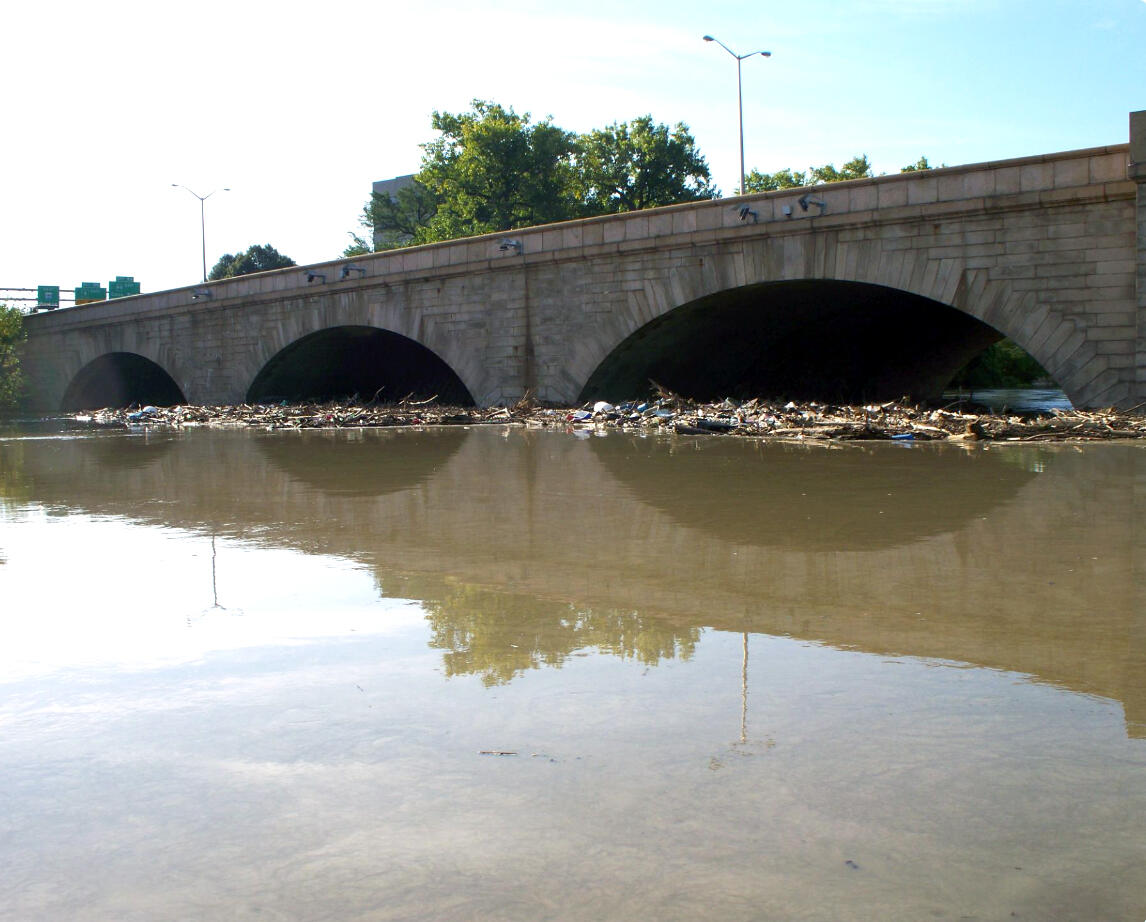
Many communities found themselves isolated after the storm passed, as roads and bridges were washed out. The landscape was changed from erosion and sediment transport, especially along the banks of the Connecticut River.

Landfall
Tropical Storm Irene made landfall during a Spring Tide, a higher than normal tide from the combined gravitational effect of the Sun and Moon. The Connecticut shoreline saw the highest storm surge from Tropical Storm Irene throughout New England, with diminishing severity moving eastward along Long Island Sound. Tropical Storm Irene had sustained winds between 46 - 63 miles per hour as it tracked through the region.

Storm Surge
When large storms make landfall, one of the greatest threats to life and property along the coast is storm surge. Storm surge is the abnormal rise of water generated by a storm, over and above the predicted astronomical tides. To help understand the mechanics of storm surge, the USGS monitors water levels during coastal storm events to learn more about the associated inundation, helping coastal communities from future storm impacts.
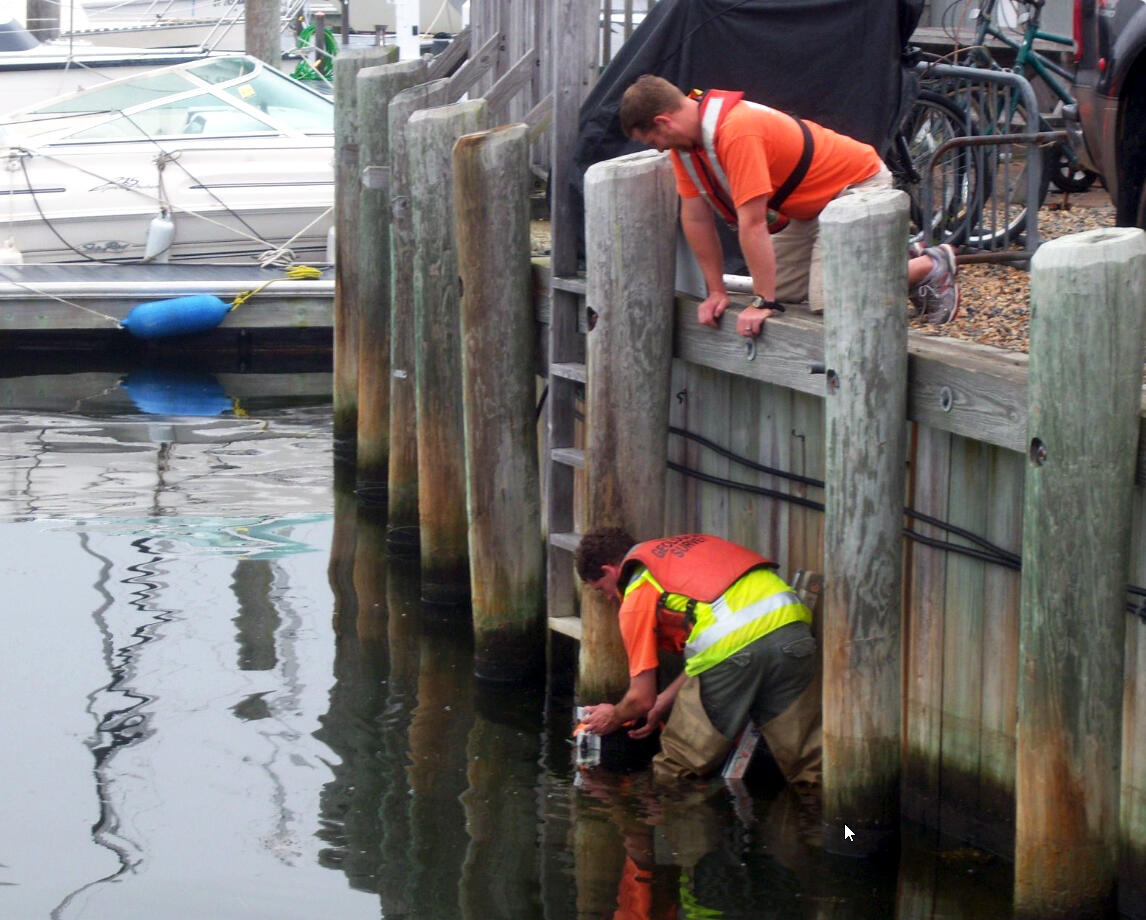
In the days prior to the arrival of Tropical Storm Irene, USGS scientists deployed water-level sensors along the New England coastline to accurately measure the storm surge by recording the water height every 30 seconds. The sensors measured three to four feet of storm surge from Greenwich, CT to Old Saybrook, CT and about two feet of surge from New London, CT to Harwich, MA (USGS Flood Event Viewer - Irene).
The National Weather Service (NWS) sets storm surge severity into Categories from 1 (lowest) to 4 (highest) using SLOSH (Sea, Lake, and Overland Surges from Hurricanes) modeling. National Storm Surge Hazard Maps.
The surge from Tropical Storm Irene along the CT coastline was in the Category 1 to 2 range based on predictions in the SLOSH models.
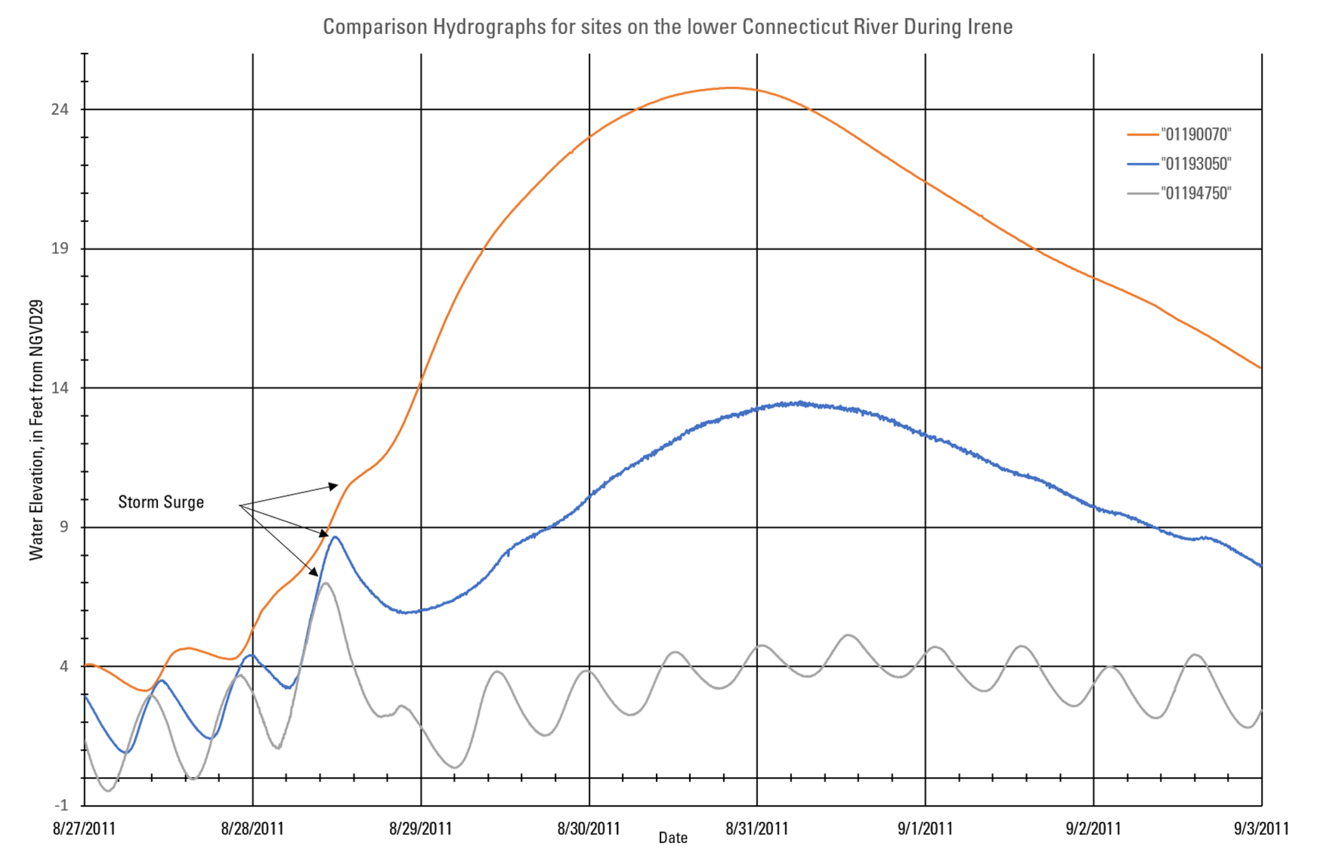
Storm surge from Tropical Storm Irene traveled well inland from the coast. The storm surge made its way up the tidal parts of the lower Housatonic, Connecticut, and Thames Rivers. The Connecticut River at Middle Haddam, CT gage (01193050), about 24 miles upstream from Long Island Sound, recorded over four feet in stage change as the river swelled from a stage of 4.4 feet to 8.6 feet during consecutive high tides, bringing the river stage above the NWS flood stage of 7 feet. Find out flood stages and forecasts for streams by you at the NOAA River Forecast Centers
While the storm surge was noticeable at Middle Haddam, it was minor in comparison to the peak flood stage that would occur later from inland flooding, 13.4 feet on August 31st.
Storm surge data for Tropical Storm Irene can be found on the USGS Flood Event Viewer, along with data from other major storm events: Flood Event Viewer.
Inland Flooding
When Tropical Storm Irene tracked through New England, many streams were already above or much-above normal streamflow for the time of year. The combination of elevated streamflow and saturated soils from recent precipitation created prime conditions for flooding to occur. As the storm moved inland, the effected parts of western Connecticut and Massachusetts, Vermont, and north-central New Hampshire experienced torrential rain and high winds. Most of this area received 3-8 inches of rain in less than 18 hours, with small areas receiving up to 10 inches of rain. The resulting flood was devastating to the region and to Vermont in particular. In the Green Mountains of Vermont, floodwaters damaged or destroyed more than 480 bridges, 960 culverts, and 500 miles of State highways isolating 13 communities for days (Pealer, 2012).
Data from Tropical Storm Irene was compared to long-term historical data. Overall, 35 streamgages in New England recorded peak streamflows above the estimated 100-year flood and 9 exceeded the 500-year flood (Suro and others, 2015). Find out more about the 100-year flood at the USGS Water Science School.
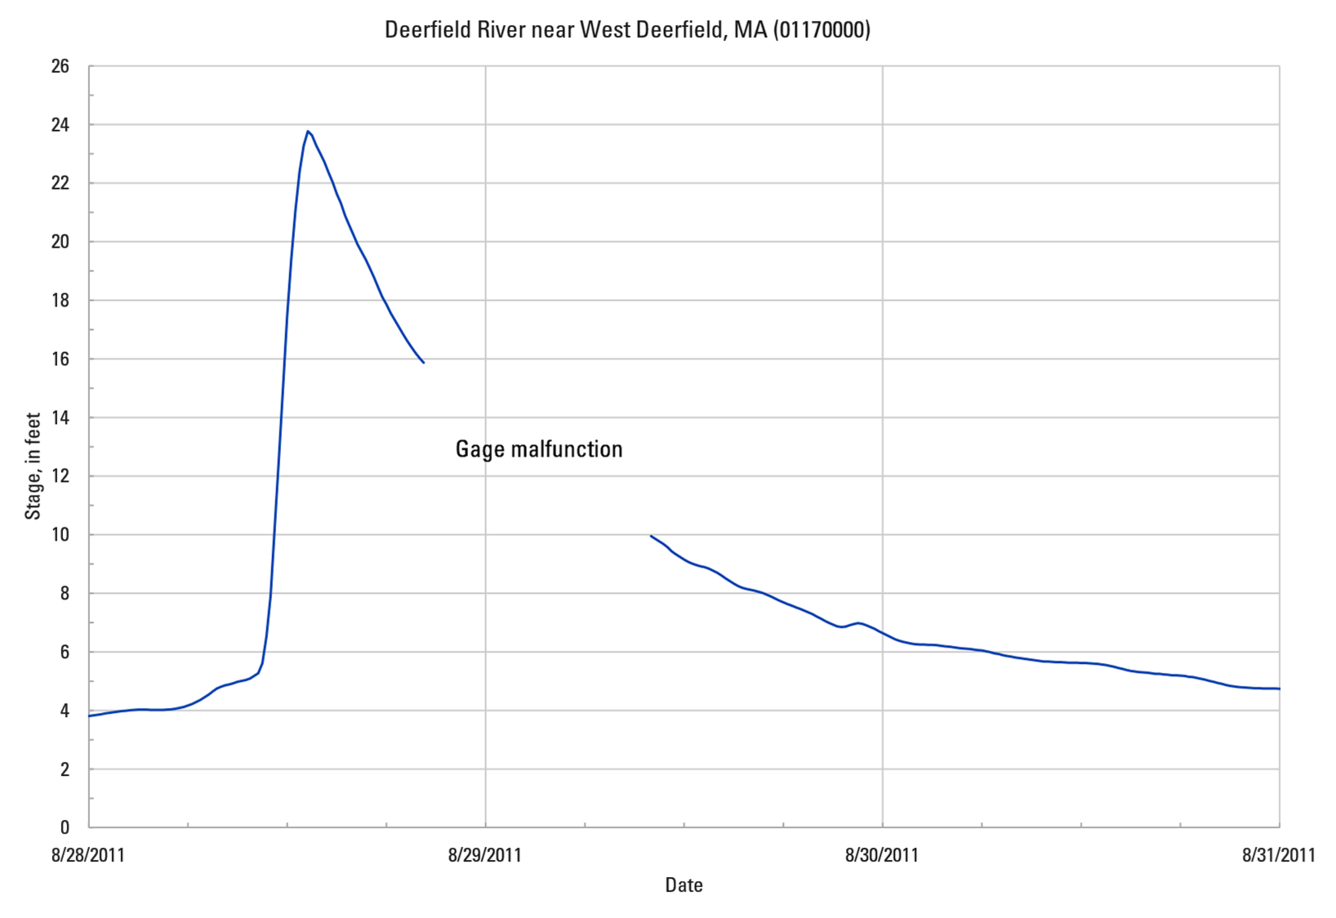
Peak-of-record streamflows occurred at 29 streamgages in New England. The Deerfield River near West Deerfield, MA (USGS station 01170000) recorded the highest streamflow in the 70-year period of record as the river stage rose nearly 20 feet in less than 4 hours because of the combination of intense rainfall on saturated soils. In the Deerfield and Hoosic River Basins in northwestern Massachusetts, new peaks of record were set at six of the eight USGS long-term streamgages with 46 to 100 years of record (Bent and others, 2016).
Sediment Transport
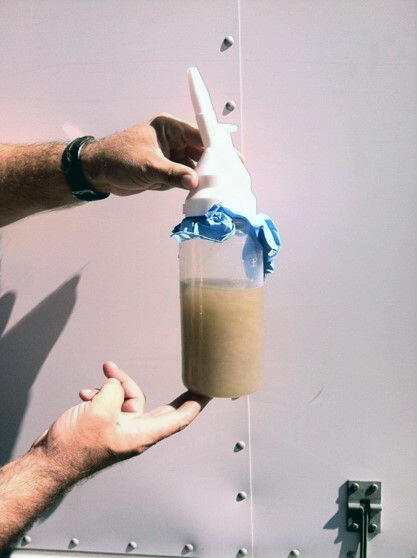
Storm events can erode sediment particles from fine-grained silt and clay to coarser-grained sand and gravel from the landscape into rivers. Sediment transport occurs when sediments are carried downstream by the river’s current. The faster the water velocity, the easier it is for particles to be suspended within the river and move downstream. This is what leads to a stream’s muddy appearance during and directly after storm events. Find out more about sediment and transport here.
Tropical Storm Irene’s intense rainfall over the Berkshires, the Green and White Mountains of New England created optimal conditions for sediment transport. Within these steeper catchments, extreme floods, and resultant landscape disturbances (e.g., landslides, gully erosion, channel incision, and scour) play a major role in making sediment available for transport (Yellen and others, 2014). The intense rainfall from Tropical Storm Irene resulted in numerous landslides, the washing out of stream, and bank erosion. Sand, silt, and clay particles were washed into the streams and carried downriver as far away as the Long Island Sound and the Gulf of Maine.
The USGS determines the suspended sediment concentration (SSC) by collecting samples from the river and by laboratory measurement of the weight of sediment within the sample volume. Knowing the SSC is important, by combining SSC with streamflow, the suspended-sediment load or the amount of material being transported over time can be determined. In the days following Tropical Storm Irene’s landfall, Connecticut River at Thompsonville, CT (01184000) had the highest SSC for the period of record, dating back to 1974. Samples collected at Thompsonville on August 29th, 30th, and 31st had concentrations from 1,330, 1,660 and 1,760 milligrams per liter, respectively. Combining these SSC with the computed streamflow estimated the total sediment load transported through the Connecticut River to be 373,000 to 556,000 tons per day (U.S. Geological Survey, 2021). This is comparable to about 8,206,000 to 12,232,000 cubic feet of sediment each day.
Turbidity is a measure of the clarity of water. As concentrations of fine particles increase in the stream, the turbidity increases. A turbidity sensor was operating at the Connecticut River at Middle Haddam, CT (01193050) during the days after Tropical Storm Irene and recorded the changes in turbidity of the Connecticut River. The first peak in turbidity of 430 Formazin Nephelometric Unit (FNU) was recorded on August 30th. during the rising limb of the streamflow hydrograph, the sensor had been ranging 1-4 FNU in the days prior to Tropical Storm Irene arriving. A second peak was recorded on August 31st, which nearly coincides with the peak in streamflow, with a maximum of 600 FNU, this is the highest recorded turbidity value, as of 2021, since turbidity began being recorded in September of 2010. In comparison, typical annual maximum turbidity values range from 100 to 200 FNU, indicating that this was a substantial sediment transport event.

Monitoring the Flood
The USGS uses may different techniques and methods to measure streamflow and to document the impacts of flooding events. During Tropical Storm Irene, USGS personnel were deployed to make direct observations of the flooding and to ensure that the real-time streamgage network continued to record and transmit data throughout the event. After the flood waters receded, USGS personnel continued data collection by making indirect measurements of peak streamflow, inspecting crest stage gages and identifying and surveying the height of highwater marks, in order to document the storm.
The collection of these data and the evidence of the event can be combined to provide a regional view of the areal extent of the flood waters, creating a post storm view of the flood event in its entirety.

Hydrologic Monitoring Network
The streamgage network provides near real-time data as to conditions of streams and rivers, learn about the USGS streamgage network here. This network is crucial for flood and drought monitoring, emergency response, and dam and reservoir-system flood control and water-supply operations. Observations of the historic flows caused by Tropical Storm Irene have been integrated into the discharge ratings at the affected streamgages providing for more accurate real-time flow data during future flood events.
In preparation for the storm surge associated with Tropical Storm Irene, storm tide sensors and rapid deployment gages were deployed along the south facing coasts of Long Island Sound, Narragansett Bay, Buzzards Bay, and Nantucket Sound, as well as NH’s and southern Maine’s coastline. The purpose of this temporary network was to monitor and document the effect and extent of storm surge during the event. In total 63 sensors were deployed to gather water-level data once every 30 seconds. This allowed for determination of the maximum storm tide. The USGS has since formalized storm sensor deployments for coastal storms with the Surge, Wave, and Tide Hydrodynamics (SWaTH) Network as a result of Hurricane Sandy, which made landfall along the northeastern Atlantic coast of the United States in October of 2012 (Verdi and others, 2017). Learn more about the SWaTH network here.

High Water Marks
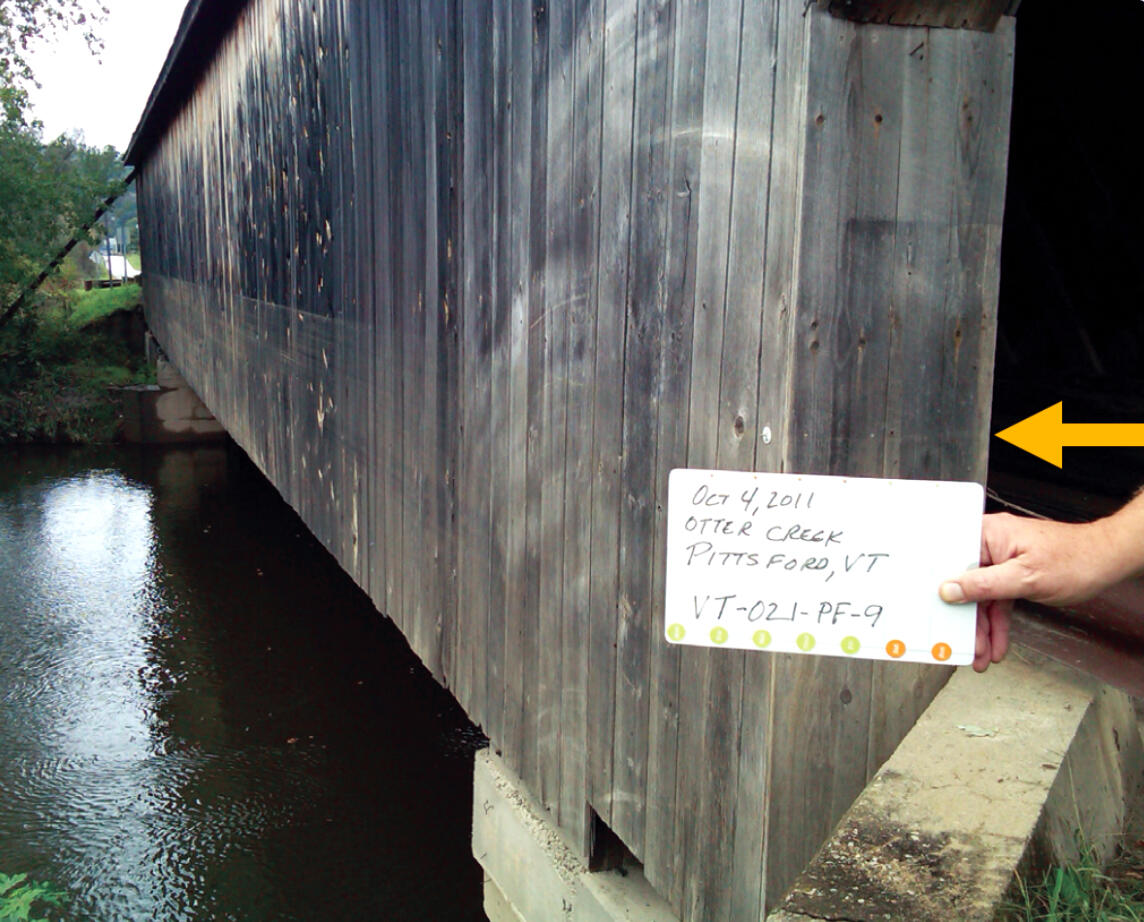
When the flood waters receded, USGS personnel were deployed to flag and document HWMs. These marks were left by sediment and debris (seeds, needles, twigs, trash, etc.) that were carried by flood waters. HWMs were determined by identifying characteristics, such as discoloration on houses or covered bridges, small seed lines on a sign or in the bark of a tree, to vegetation laid over, and lines of debris deposited along riverbanks.
Following Tropical Storm Irene, about 1300 HWMs were flagged and surveyed in Massachusetts, New Hampshire, and Vermont (Medalie and Olson, 2013; Bent and others, 2013), and can be viewed in USGS Flood Event Viewer. Maybe you can find a HWM that was documented near your home on the USGS Flood Event Viewer.
These HWMs were used by USGS personnel to compute 23 indirect measurements of the peak streamflow at streamgages for this flood event. Given the magnitude of this flood, these determinations of peak flow from the residual evidence are the only information that was able to be collected as direct measurement of stream-flows during the storm were not possible.
Planning for the Future
Following a flood, USGS provides assessments crucial to the mitigation of future flood hazards. After Tropical Storm Irene, USGS computed peak-flow recurrence intervals, developed hydraulic models to create flood recovery maps and flood-inundation maps. Much of this work was done in cooperation with the Federal Emergency Management Agency (FEMA)to create flood recovery maps to document the areal extent of flooding to aid communities in rebuilding safely (Kiah and others, 2013; Olson and Bent, 2013; Flynn, 2014; Olson, 2014; Bent and others, 2015; Lombard and Bent, 2015a and 2015b; Olson, 2015a and 2015b; Suro and others, 2015; Bent and others, 2016; Flynn and others, 2016)
Check out the USGS Flood Inundation Mapper here.
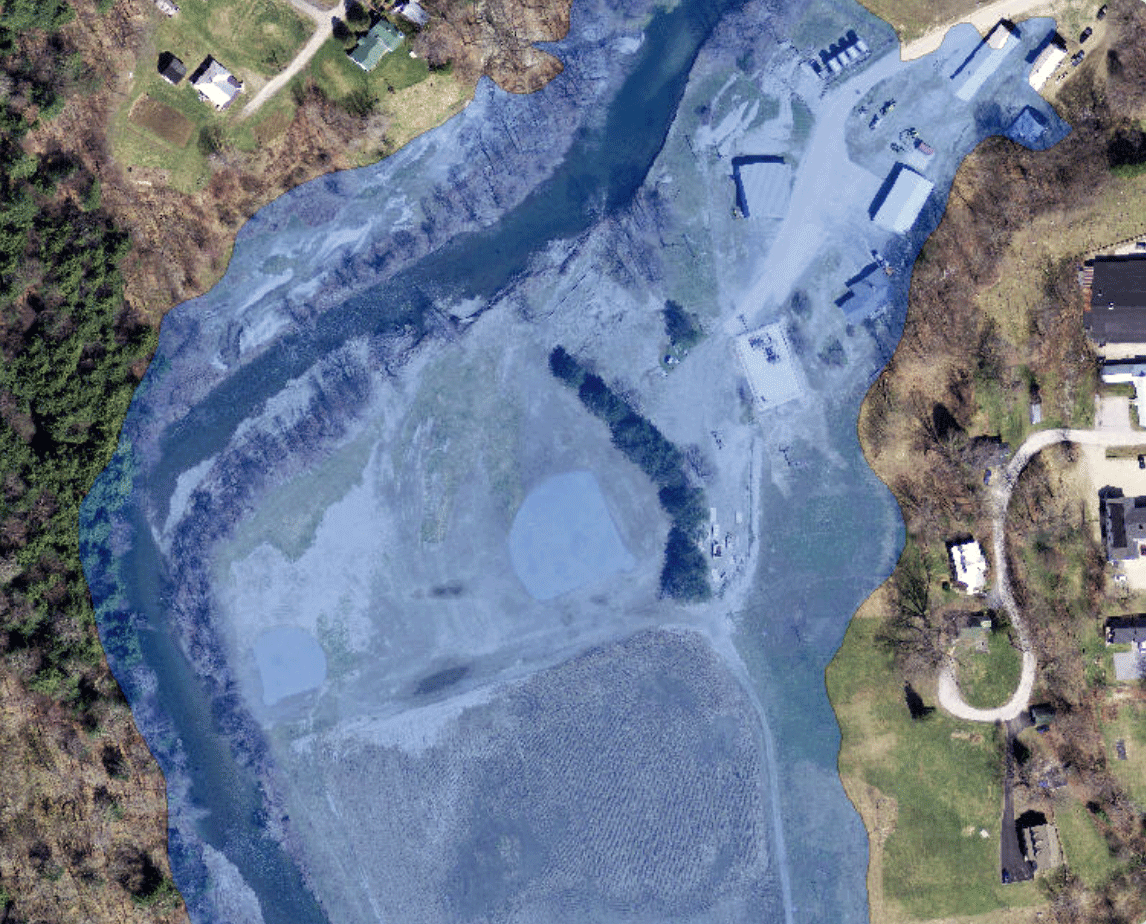
Flood-inundation maps show current and forecasted stage and the associated flood-inundated areas overlaid, if the river stage is at or above bankfull stage, on high-resolution, georeferenced aerial photographs of an area. HWMs like those collected after Tropical Storm Irene are used in calibration of the hydrologic models used in the creation of these inundation maps. The maps provide emergency management personnel and communities with flood with information on the areal extent and depth of flooding that is critical for response activities, such as building evacuations, road closures, disaster declarations, and recovery efforts.
The USGS New England Water Science Center has, through a continuing partnership with FEMA, developed and continues to develop updated Flood Insurance Study (FIS) and the associated Flood Insurance Rate Maps (FIRMs) maps for river reaches across New England. To learn more visit Development of Flood Insurance Maps in New England web page
Flood Hardening
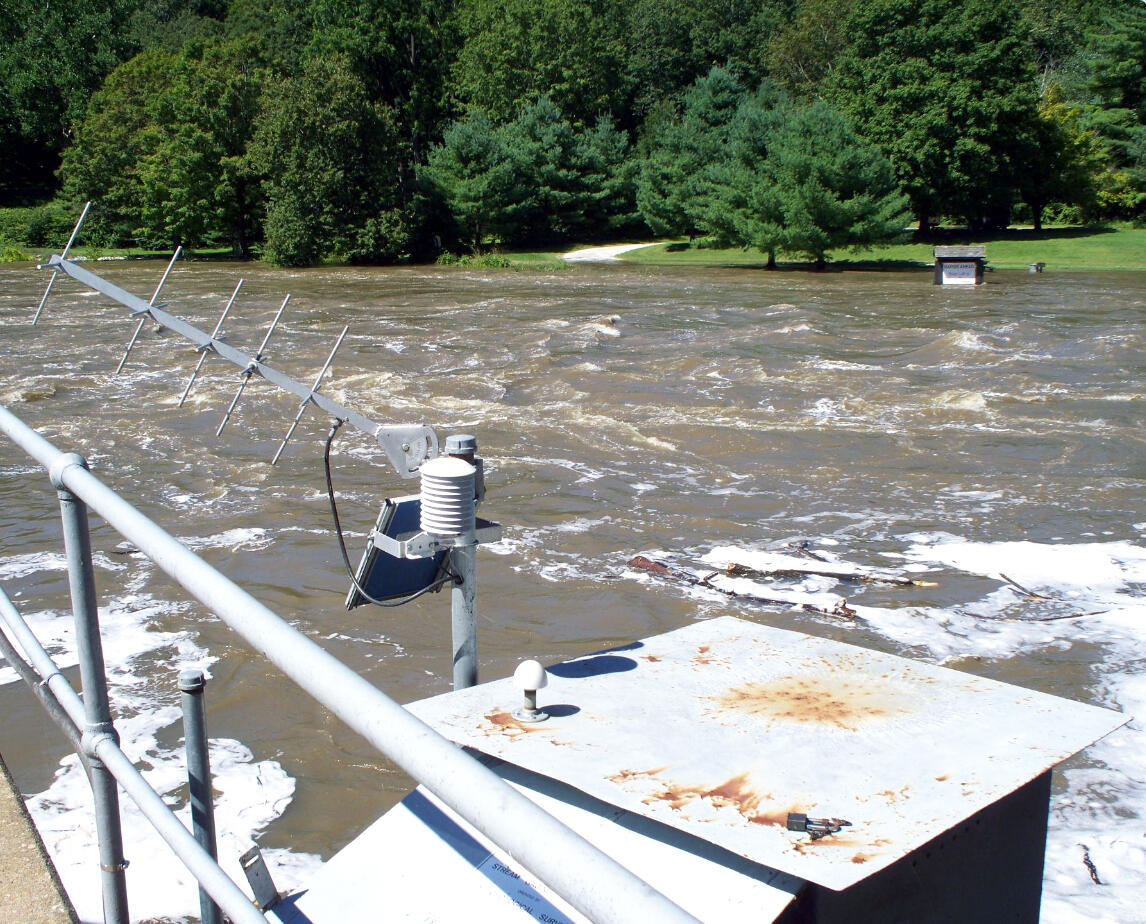
While the majority of streamgages provided continuous data during Tropical Storm Irene, the historic flooding led to several streamgages being inundated, which damaged equipment resulting in a loss of data. As a result of Tropical Storm Irene, a campaign to flood-harden streamgages was started by the USGS. The purpose of flood hardening is to ensure that the streamgage structures and especially the equipment is above the 0.5% percent annual exceedance probability flood flow (200-year recurrence interval flood flow). These streamgages have been reconfigured to ensure the equipment will continue to function, or a new gage structure has been built to house the equipment safely during extreme floods.
For more information about the New England Water Science Center’s response to natural hazards, see the New England Fact sheet on Flood- and Drought-related activities.

References
Bent, G.C., Medalie, Laura, and Nielsen, M.G., 2013, High-water marks from tropical storm Irene for selected river reaches in northwestern Massachusetts, August 2011: U.S. Geological Survey Data Series 775, 13 p., https://pubs.usgs.gov/ds/775/
Bent, G.C., Lombard, P.J., and Dudley, R.W., 2015, Flood-inundation maps for the North River in Colrain, Charlemont, and Shelburne, Massachusetts, from the confluence of the East and West Branch North Rivers to the Deerfield River: U.S. Geological Survey Scientific Investigations Report 2015–5108, 16 p., appendixes, https://dx.doi.org/10.3133/sir20155108
Bent, G.C., Olson, S.A., and Massey, A.J., 2016, Tropical storm Irene flood of August 2011 in northwestern Massachusetts: U.S. Geological Survey Scientific Investigations Report 2016–5027, 28 p., https://dx.doi.org/10.3133/sir20165027
Fanelli, C., and Fanelli, P., 2011, NOAA water level and meteorological data report—Hurricane Irene: U.S.
Department of Commerce, National Oceanic and Atmospheric Administration, National Ocean Service
Center for Operational Oceanographic Products and Services, accessed August 9, 2021, at https://tidesandcurrents.noaa.gov/publications/Hurricane_Irene_Water_Level_and_Meteorological_Data_Report.pdf
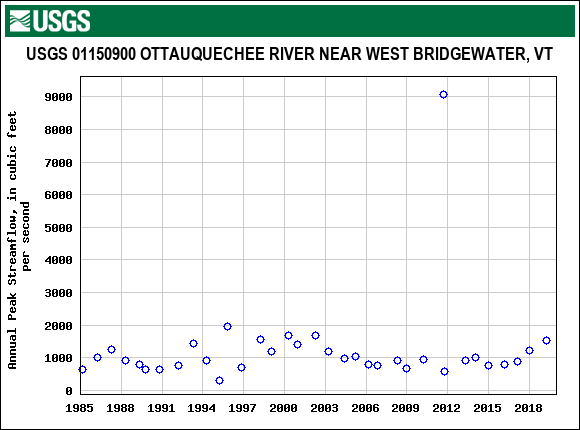
Flynn, R.H., 2014, Analysis of floods, including the tropical storm Irene inundation, of the Ottauquechee River in Woodstock, Bridgewater, and Killington and of Reservoir Brook in Bridgewater and Plymouth, Vermont: U.S. Geological Survey Scientific Investigations Report 2014–5214, 13 p., https://dx.doi.org/10.3133/sir20145214
Flynn, R.H., Bent, G.C., and Lombard, P.J., 2016, Flood-inundation maps for the Green River in Colrain, Leyden, and Greenfield, Massachusetts, from U.S. Geological Survey streamgage 01170100 Green River near Colrain to the confluence with the Deerfield River (ver. 1.1, November 2016): U.S. Geological Survey Scientific Investigations Report 2016–5107, 18 p., appendixes, https://doi.org/10.3133/sir20165107
Kiah, R.G., Jarvis, J.D., Hegemann, R.F., Hilgendorf, G.S., and Ward, S.L., 2013, Hydrologic conditions in New Hampshire and Vermont, water year 2011: U.S. Geological Survey Open-File Report 2013–1135, 36 p., https://pubs.usgs.gov/of/2013/1135/
Lahiff, Conor, 2015, Preliminary Hurricane/Tropical Storm Irene Weather Summary for the North Country: National Oceanic and Atmospheric Administration, accessed April 28, 2021, https://www.weather.gov/media/btv/events/Irene2011/Irene2011.pdf
Lombard, P.J., and Bent, G.C., 2015a, Flood-inundation maps for the Deerfield River, Franklin County, Massachusetts, from the confluence with the Cold River tributary to the Connecticut River: U.S. Geological Survey Scientific Investigations Report 2015–5104, 22 p., appendixes, https://dx.doi.org/10.3133/sir20155104
Lombard, P.J., and Bent, G.C., 2015b, Flood-inundation maps for the Hoosic River, North Adams and Williamstown, Massachusetts, from the confluence with the North Branch Hoosic River to the Vermont state line: U.S. Geological Survey Scientific Investigations Report 2014–5236, 16 p., appendixes, https://dx.doi.org/10.3133/sir20145236
Medalie, Laura, and Olson, S.A., 2013, High-water marks from flooding in Lake Champlain from April through June 2011 and Tropical Storm Irene in August 2011 in Vermont: U.S. Geological Survey Data Series 763, 11 p., https://pubs.usgs.gov/ds/763/
Northeast Regional Climate Center, 2021, Monthly/seasonal climate summary tables – August 2011 precipitation: website accessed July 28, 2021 at https://www.nrcc.cornell.edu/regional/tables/tables.html
Olson, S.A., and Bent, G.C., 2013, Annual exceedance probabilities of the peak discharges of 2011 at streamgages in Vermont and selected streamgages in New Hampshire, western Massachusetts, and northeastern New York: U.S. Geological Survey Scientific Investigations Report 2013–5187, 17 p., https://dx.doi.org/10.3133/sir20135187
Olson, S.A., 2014, Estimation of flood discharges at selected annual exceedance probabilities for unregulated, rural streams in Vermont, with a section on Vermont regional skew regression, by Veilleux, A.G.: U.S. Geological Survey Scientific Investigations Report 2014–5078, 27 p. plus appendixes, https://dx.doi.org/10.3133/sir20145078
Olson, S.A., 2015, Flood recovery maps for the White River in Bethel, Stockbridge, and Rochester, Vermont, and the Tweed River in Stockbridge and Pittsfield, Vermont, 2014: U.S. Geological Survey Scientific Investigations Report 2015–5056, 32 p., https://dx.doi.org/10.3133/sir20155056
Olson, S.A., 2015b, Flood maps for the Winooski River in Waterbury, Vermont, 2014: U.S. Geological Survey Scientific Investigations Report 2015–5077, 25 p., https://dx.doi.org/10.3133/sir20155077
Pealer, Sacha, 2012, Lessons from Irene: Building resiliency as we rebuild: Vermont Agency of Natural Resources, https://anr.vermont.gov/sites/anr/files/specialtopics/climate/documents/factsheets/Irene_Facts.pdf
Suro, T.P., Roland, M.A., and Kiah, R.G., 2015, Flooding in the Northeastern United States, 2011: U.S. Geological Survey Professional Paper 1821, 32 p., https://dx.doi.org/10.3133/pp1821
U.S. Geological Survey, 2021, National Water Information System (NWIS) database, online at https://doi.org/10.5066/F7P55KJN, accessed on June 1, 2021.
Yellen B., Woodruff J.D., Kratz L.N., Mabee S.B., Morrison J., and Martini A.M., 2014, Source, conveyance and fate of suspended sediments following Hurricane Irene, New England, USA, Geomorphology, v. 226, 2014, pages 124-134, https://doi.org/10.1016/j.geomorph.2014.07.028

Acknowledgments
Produced by the USGS New England Water Science Center. August 2021.
Authors and Contacts:
Ian Carlisle
Richard Verdi
Tropical Storm Irene arrived in New England on August 28, 2011, bringing extreme winds, rapidly changing pressure, and record-setting rainfall to the region. Over the next 18 hours, the resulting coastal flooding and historic riverine flooding resulted in damages estimated to be in excess of $7 billion and approximately 45 deaths (Suro and others, 2015).
The U.S. Geological Survey (USGS) was actively involved in preparing for and assisting with the long-term recovery from this historic flood. This story examines the impact of Tropical Storm Irene and the role of USGS monitoring and science in identifying, understanding, and mitigating flood risks.
Introduction
Landfall
Storm Surge
Inland Flooding
Sediment Transport
Monitoring the Flood
Hydrologic Monitoring Network
High Water Marks
Planning for the Future
Flood Hardening
References
Acknowledgements
Introduction
Hurricane Irene formed in the Caribbean off of Puerto Rico on August 22, 2011, reaching a maximum of category 3 on August 24th, before making first landfall on August 27th in North Carolina. The storm continued just offshore, up the Eastern coast of the United States before making second landfall near Little Egg Inlet, New Jersey where it was downgraded to a tropical storm (Lahiff, 2015). On August 28th, Tropical Storm Irene made its way into Connecticut and continued northward through New England with the eye of the storm tracking almost directly up the Connecticut River Valley.
The Tropical Storm combined with an astronomical high tide, due to the new moon phase, in Long Island Sound caused a destructive storm surge along the coast. As the storm moved inland, most areas in western Massachusetts and Vermont would receive 3-8 inches of rain in the 18 hours it took the storm to pass through the area. Some areas received more than 10 inches of rain, which contributed to the wettest August records for New Hampshire and Vermont, and the 2nd wettest on record for Connecticut, Maine, and Massachusetts (Northeast Regional Climate Center, 2021). Two days before Tropical Storm Irene hit New England, streamflows at 100% of the streamgage network were at or above normal conditions, with 47% of the streamflow in the network at the 90th percentile or higher. This, combined with the intense precipitation during the storm event brought about drastic flooding.
Many communities found themselves isolated after the storm passed, as roads and bridges were washed out. The landscape was changed from erosion and sediment transport, especially along the banks of the Connecticut River.
Landfall
Tropical Storm Irene made landfall during a Spring Tide, a higher than normal tide from the combined gravitational effect of the Sun and Moon. The Connecticut shoreline saw the highest storm surge from Tropical Storm Irene throughout New England, with diminishing severity moving eastward along Long Island Sound. Tropical Storm Irene had sustained winds between 46 - 63 miles per hour as it tracked through the region.
Storm Surge
When large storms make landfall, one of the greatest threats to life and property along the coast is storm surge. Storm surge is the abnormal rise of water generated by a storm, over and above the predicted astronomical tides. To help understand the mechanics of storm surge, the USGS monitors water levels during coastal storm events to learn more about the associated inundation, helping coastal communities from future storm impacts.
In the days prior to the arrival of Tropical Storm Irene, USGS scientists deployed water-level sensors along the New England coastline to accurately measure the storm surge by recording the water height every 30 seconds. The sensors measured three to four feet of storm surge from Greenwich, CT to Old Saybrook, CT and about two feet of surge from New London, CT to Harwich, MA (USGS Flood Event Viewer - Irene).
The National Weather Service (NWS) sets storm surge severity into Categories from 1 (lowest) to 4 (highest) using SLOSH (Sea, Lake, and Overland Surges from Hurricanes) modeling. National Storm Surge Hazard Maps.
The surge from Tropical Storm Irene along the CT coastline was in the Category 1 to 2 range based on predictions in the SLOSH models.
Storm surge from Tropical Storm Irene traveled well inland from the coast. The storm surge made its way up the tidal parts of the lower Housatonic, Connecticut, and Thames Rivers. The Connecticut River at Middle Haddam, CT gage (01193050), about 24 miles upstream from Long Island Sound, recorded over four feet in stage change as the river swelled from a stage of 4.4 feet to 8.6 feet during consecutive high tides, bringing the river stage above the NWS flood stage of 7 feet. Find out flood stages and forecasts for streams by you at the NOAA River Forecast Centers
While the storm surge was noticeable at Middle Haddam, it was minor in comparison to the peak flood stage that would occur later from inland flooding, 13.4 feet on August 31st.
Storm surge data for Tropical Storm Irene can be found on the USGS Flood Event Viewer, along with data from other major storm events: Flood Event Viewer.
Inland Flooding
When Tropical Storm Irene tracked through New England, many streams were already above or much-above normal streamflow for the time of year. The combination of elevated streamflow and saturated soils from recent precipitation created prime conditions for flooding to occur. As the storm moved inland, the effected parts of western Connecticut and Massachusetts, Vermont, and north-central New Hampshire experienced torrential rain and high winds. Most of this area received 3-8 inches of rain in less than 18 hours, with small areas receiving up to 10 inches of rain. The resulting flood was devastating to the region and to Vermont in particular. In the Green Mountains of Vermont, floodwaters damaged or destroyed more than 480 bridges, 960 culverts, and 500 miles of State highways isolating 13 communities for days (Pealer, 2012).
Data from Tropical Storm Irene was compared to long-term historical data. Overall, 35 streamgages in New England recorded peak streamflows above the estimated 100-year flood and 9 exceeded the 500-year flood (Suro and others, 2015). Find out more about the 100-year flood at the USGS Water Science School.
Peak-of-record streamflows occurred at 29 streamgages in New England. The Deerfield River near West Deerfield, MA (USGS station 01170000) recorded the highest streamflow in the 70-year period of record as the river stage rose nearly 20 feet in less than 4 hours because of the combination of intense rainfall on saturated soils. In the Deerfield and Hoosic River Basins in northwestern Massachusetts, new peaks of record were set at six of the eight USGS long-term streamgages with 46 to 100 years of record (Bent and others, 2016).
Sediment Transport
Storm events can erode sediment particles from fine-grained silt and clay to coarser-grained sand and gravel from the landscape into rivers. Sediment transport occurs when sediments are carried downstream by the river’s current. The faster the water velocity, the easier it is for particles to be suspended within the river and move downstream. This is what leads to a stream’s muddy appearance during and directly after storm events. Find out more about sediment and transport here.
Tropical Storm Irene’s intense rainfall over the Berkshires, the Green and White Mountains of New England created optimal conditions for sediment transport. Within these steeper catchments, extreme floods, and resultant landscape disturbances (e.g., landslides, gully erosion, channel incision, and scour) play a major role in making sediment available for transport (Yellen and others, 2014). The intense rainfall from Tropical Storm Irene resulted in numerous landslides, the washing out of stream, and bank erosion. Sand, silt, and clay particles were washed into the streams and carried downriver as far away as the Long Island Sound and the Gulf of Maine.
The USGS determines the suspended sediment concentration (SSC) by collecting samples from the river and by laboratory measurement of the weight of sediment within the sample volume. Knowing the SSC is important, by combining SSC with streamflow, the suspended-sediment load or the amount of material being transported over time can be determined. In the days following Tropical Storm Irene’s landfall, Connecticut River at Thompsonville, CT (01184000) had the highest SSC for the period of record, dating back to 1974. Samples collected at Thompsonville on August 29th, 30th, and 31st had concentrations from 1,330, 1,660 and 1,760 milligrams per liter, respectively. Combining these SSC with the computed streamflow estimated the total sediment load transported through the Connecticut River to be 373,000 to 556,000 tons per day (U.S. Geological Survey, 2021). This is comparable to about 8,206,000 to 12,232,000 cubic feet of sediment each day.
Turbidity is a measure of the clarity of water. As concentrations of fine particles increase in the stream, the turbidity increases. A turbidity sensor was operating at the Connecticut River at Middle Haddam, CT (01193050) during the days after Tropical Storm Irene and recorded the changes in turbidity of the Connecticut River. The first peak in turbidity of 430 Formazin Nephelometric Unit (FNU) was recorded on August 30th. during the rising limb of the streamflow hydrograph, the sensor had been ranging 1-4 FNU in the days prior to Tropical Storm Irene arriving. A second peak was recorded on August 31st, which nearly coincides with the peak in streamflow, with a maximum of 600 FNU, this is the highest recorded turbidity value, as of 2021, since turbidity began being recorded in September of 2010. In comparison, typical annual maximum turbidity values range from 100 to 200 FNU, indicating that this was a substantial sediment transport event.
Monitoring the Flood
The USGS uses may different techniques and methods to measure streamflow and to document the impacts of flooding events. During Tropical Storm Irene, USGS personnel were deployed to make direct observations of the flooding and to ensure that the real-time streamgage network continued to record and transmit data throughout the event. After the flood waters receded, USGS personnel continued data collection by making indirect measurements of peak streamflow, inspecting crest stage gages and identifying and surveying the height of highwater marks, in order to document the storm.
The collection of these data and the evidence of the event can be combined to provide a regional view of the areal extent of the flood waters, creating a post storm view of the flood event in its entirety.
Hydrologic Monitoring Network
The streamgage network provides near real-time data as to conditions of streams and rivers, learn about the USGS streamgage network here. This network is crucial for flood and drought monitoring, emergency response, and dam and reservoir-system flood control and water-supply operations. Observations of the historic flows caused by Tropical Storm Irene have been integrated into the discharge ratings at the affected streamgages providing for more accurate real-time flow data during future flood events.
In preparation for the storm surge associated with Tropical Storm Irene, storm tide sensors and rapid deployment gages were deployed along the south facing coasts of Long Island Sound, Narragansett Bay, Buzzards Bay, and Nantucket Sound, as well as NH’s and southern Maine’s coastline. The purpose of this temporary network was to monitor and document the effect and extent of storm surge during the event. In total 63 sensors were deployed to gather water-level data once every 30 seconds. This allowed for determination of the maximum storm tide. The USGS has since formalized storm sensor deployments for coastal storms with the Surge, Wave, and Tide Hydrodynamics (SWaTH) Network as a result of Hurricane Sandy, which made landfall along the northeastern Atlantic coast of the United States in October of 2012 (Verdi and others, 2017). Learn more about the SWaTH network here.
High Water Marks
When the flood waters receded, USGS personnel were deployed to flag and document HWMs. These marks were left by sediment and debris (seeds, needles, twigs, trash, etc.) that were carried by flood waters. HWMs were determined by identifying characteristics, such as discoloration on houses or covered bridges, small seed lines on a sign or in the bark of a tree, to vegetation laid over, and lines of debris deposited along riverbanks.
Following Tropical Storm Irene, about 1300 HWMs were flagged and surveyed in Massachusetts, New Hampshire, and Vermont (Medalie and Olson, 2013; Bent and others, 2013), and can be viewed in USGS Flood Event Viewer. Maybe you can find a HWM that was documented near your home on the USGS Flood Event Viewer.
These HWMs were used by USGS personnel to compute 23 indirect measurements of the peak streamflow at streamgages for this flood event. Given the magnitude of this flood, these determinations of peak flow from the residual evidence are the only information that was able to be collected as direct measurement of stream-flows during the storm were not possible.
Planning for the Future
Following a flood, USGS provides assessments crucial to the mitigation of future flood hazards. After Tropical Storm Irene, USGS computed peak-flow recurrence intervals, developed hydraulic models to create flood recovery maps and flood-inundation maps. Much of this work was done in cooperation with the Federal Emergency Management Agency (FEMA)to create flood recovery maps to document the areal extent of flooding to aid communities in rebuilding safely (Kiah and others, 2013; Olson and Bent, 2013; Flynn, 2014; Olson, 2014; Bent and others, 2015; Lombard and Bent, 2015a and 2015b; Olson, 2015a and 2015b; Suro and others, 2015; Bent and others, 2016; Flynn and others, 2016)
Check out the USGS Flood Inundation Mapper here.
Flood-inundation maps show current and forecasted stage and the associated flood-inundated areas overlaid, if the river stage is at or above bankfull stage, on high-resolution, georeferenced aerial photographs of an area. HWMs like those collected after Tropical Storm Irene are used in calibration of the hydrologic models used in the creation of these inundation maps. The maps provide emergency management personnel and communities with flood with information on the areal extent and depth of flooding that is critical for response activities, such as building evacuations, road closures, disaster declarations, and recovery efforts.
The USGS New England Water Science Center has, through a continuing partnership with FEMA, developed and continues to develop updated Flood Insurance Study (FIS) and the associated Flood Insurance Rate Maps (FIRMs) maps for river reaches across New England. To learn more visit Development of Flood Insurance Maps in New England web page
Flood Hardening
While the majority of streamgages provided continuous data during Tropical Storm Irene, the historic flooding led to several streamgages being inundated, which damaged equipment resulting in a loss of data. As a result of Tropical Storm Irene, a campaign to flood-harden streamgages was started by the USGS. The purpose of flood hardening is to ensure that the streamgage structures and especially the equipment is above the 0.5% percent annual exceedance probability flood flow (200-year recurrence interval flood flow). These streamgages have been reconfigured to ensure the equipment will continue to function, or a new gage structure has been built to house the equipment safely during extreme floods.
For more information about the New England Water Science Center’s response to natural hazards, see the New England Fact sheet on Flood- and Drought-related activities.
References
Bent, G.C., Medalie, Laura, and Nielsen, M.G., 2013, High-water marks from tropical storm Irene for selected river reaches in northwestern Massachusetts, August 2011: U.S. Geological Survey Data Series 775, 13 p., https://pubs.usgs.gov/ds/775/
Bent, G.C., Lombard, P.J., and Dudley, R.W., 2015, Flood-inundation maps for the North River in Colrain, Charlemont, and Shelburne, Massachusetts, from the confluence of the East and West Branch North Rivers to the Deerfield River: U.S. Geological Survey Scientific Investigations Report 2015–5108, 16 p., appendixes, https://dx.doi.org/10.3133/sir20155108
Bent, G.C., Olson, S.A., and Massey, A.J., 2016, Tropical storm Irene flood of August 2011 in northwestern Massachusetts: U.S. Geological Survey Scientific Investigations Report 2016–5027, 28 p., https://dx.doi.org/10.3133/sir20165027
Fanelli, C., and Fanelli, P., 2011, NOAA water level and meteorological data report—Hurricane Irene: U.S.
Department of Commerce, National Oceanic and Atmospheric Administration, National Ocean Service
Center for Operational Oceanographic Products and Services, accessed August 9, 2021, at https://tidesandcurrents.noaa.gov/publications/Hurricane_Irene_Water_Level_and_Meteorological_Data_Report.pdf
Flynn, R.H., 2014, Analysis of floods, including the tropical storm Irene inundation, of the Ottauquechee River in Woodstock, Bridgewater, and Killington and of Reservoir Brook in Bridgewater and Plymouth, Vermont: U.S. Geological Survey Scientific Investigations Report 2014–5214, 13 p., https://dx.doi.org/10.3133/sir20145214
Flynn, R.H., Bent, G.C., and Lombard, P.J., 2016, Flood-inundation maps for the Green River in Colrain, Leyden, and Greenfield, Massachusetts, from U.S. Geological Survey streamgage 01170100 Green River near Colrain to the confluence with the Deerfield River (ver. 1.1, November 2016): U.S. Geological Survey Scientific Investigations Report 2016–5107, 18 p., appendixes, https://doi.org/10.3133/sir20165107
Kiah, R.G., Jarvis, J.D., Hegemann, R.F., Hilgendorf, G.S., and Ward, S.L., 2013, Hydrologic conditions in New Hampshire and Vermont, water year 2011: U.S. Geological Survey Open-File Report 2013–1135, 36 p., https://pubs.usgs.gov/of/2013/1135/
Lahiff, Conor, 2015, Preliminary Hurricane/Tropical Storm Irene Weather Summary for the North Country: National Oceanic and Atmospheric Administration, accessed April 28, 2021, https://www.weather.gov/media/btv/events/Irene2011/Irene2011.pdf
Lombard, P.J., and Bent, G.C., 2015a, Flood-inundation maps for the Deerfield River, Franklin County, Massachusetts, from the confluence with the Cold River tributary to the Connecticut River: U.S. Geological Survey Scientific Investigations Report 2015–5104, 22 p., appendixes, https://dx.doi.org/10.3133/sir20155104
Lombard, P.J., and Bent, G.C., 2015b, Flood-inundation maps for the Hoosic River, North Adams and Williamstown, Massachusetts, from the confluence with the North Branch Hoosic River to the Vermont state line: U.S. Geological Survey Scientific Investigations Report 2014–5236, 16 p., appendixes, https://dx.doi.org/10.3133/sir20145236
Medalie, Laura, and Olson, S.A., 2013, High-water marks from flooding in Lake Champlain from April through June 2011 and Tropical Storm Irene in August 2011 in Vermont: U.S. Geological Survey Data Series 763, 11 p., https://pubs.usgs.gov/ds/763/
Northeast Regional Climate Center, 2021, Monthly/seasonal climate summary tables – August 2011 precipitation: website accessed July 28, 2021 at https://www.nrcc.cornell.edu/regional/tables/tables.html
Olson, S.A., and Bent, G.C., 2013, Annual exceedance probabilities of the peak discharges of 2011 at streamgages in Vermont and selected streamgages in New Hampshire, western Massachusetts, and northeastern New York: U.S. Geological Survey Scientific Investigations Report 2013–5187, 17 p., https://dx.doi.org/10.3133/sir20135187
Olson, S.A., 2014, Estimation of flood discharges at selected annual exceedance probabilities for unregulated, rural streams in Vermont, with a section on Vermont regional skew regression, by Veilleux, A.G.: U.S. Geological Survey Scientific Investigations Report 2014–5078, 27 p. plus appendixes, https://dx.doi.org/10.3133/sir20145078
Olson, S.A., 2015, Flood recovery maps for the White River in Bethel, Stockbridge, and Rochester, Vermont, and the Tweed River in Stockbridge and Pittsfield, Vermont, 2014: U.S. Geological Survey Scientific Investigations Report 2015–5056, 32 p., https://dx.doi.org/10.3133/sir20155056
Olson, S.A., 2015b, Flood maps for the Winooski River in Waterbury, Vermont, 2014: U.S. Geological Survey Scientific Investigations Report 2015–5077, 25 p., https://dx.doi.org/10.3133/sir20155077
Pealer, Sacha, 2012, Lessons from Irene: Building resiliency as we rebuild: Vermont Agency of Natural Resources, https://anr.vermont.gov/sites/anr/files/specialtopics/climate/documents/factsheets/Irene_Facts.pdf
Suro, T.P., Roland, M.A., and Kiah, R.G., 2015, Flooding in the Northeastern United States, 2011: U.S. Geological Survey Professional Paper 1821, 32 p., https://dx.doi.org/10.3133/pp1821
U.S. Geological Survey, 2021, National Water Information System (NWIS) database, online at https://doi.org/10.5066/F7P55KJN, accessed on June 1, 2021.
Yellen B., Woodruff J.D., Kratz L.N., Mabee S.B., Morrison J., and Martini A.M., 2014, Source, conveyance and fate of suspended sediments following Hurricane Irene, New England, USA, Geomorphology, v. 226, 2014, pages 124-134, https://doi.org/10.1016/j.geomorph.2014.07.028
Acknowledgments
Produced by the USGS New England Water Science Center. August 2021.
Authors and Contacts:
Ian Carlisle
Richard Verdi