An official website of the United States government
Here's how you know
Official websites use .gov
A .gov website belongs to an official government organization in the United States.
Secure .gov websites use HTTPS
A lock () or https:// means you’ve safely connected to the .gov website. Share sensitive information only on official, secure websites.
During large coastal storms, the storm surge and waves are the main cause of destruction and landscape change, transporting saline water, sediment, and debris inland. The USGS, in collaboration with stakeholders, has constructed a national Surge, Wave, and Tide Hydrodynamics (SWaTH) Network for the Atlantic, Eastern Pacific, and Central Pacific. SWaTH monitors and documents the height, extent, and timing of storm surge.
USGS hydrographer Keith Lambert installs a rapid deployment gage at New Mill Creek at Chesapeake, VA, in advance of Hurricane Dorian. (Credit: Blake Dudding, USGS)
Scientific information, if reliably obtained and wisely applied, can strengthen our efforts to build resilient coastal communities before storms strike, and guide our response and recovery strategies. Past storms have shown that storm surge and waves are the primary drivers of coastal-community destruction and dramatic changes in the coastal and near-coastal environment. The energy of the surge and accompanying waves cause physical changes to the landscape. The landward extent of the surge (storm tide) transports saline water, sediment, and debris to constructed and ecologically sensitive environments that are, otherwise, rarely impacted by direct ocean waters. As we develop more effective coastal-management approaches, we have the opportunity to build on our experience and knowledge to prepare for and minimize risks from future storms. Documenting the height, extent, and timing of storm surge and understanding how overland storm tide and waves evolve and dissipate when they move across natural and man-made landscapes, is critical for improved storm-surge modeling. That in turn, will promote coastal resilience, facilitate better planning, and provide more effective early warning of storm-driven flooding.
Background
For decades, the USGS has provided critical information on near-shore storm hydrodynamics for decisions regarding emergency response and resource allocation before, during, and immediately after landfall of hurricanes and nor’easters. Much of this information was provided via a few real-time tide gages focused on near-shore waters that supplemented and extended the National Oceanographic and Atmospheric Administration’s (NOAA) National Ocean Service (NOS) tide-gage network. In addition, data from temporary sensors and high-water marks occasionally obtained by the USGS in cooperation with the Federal Emergency Management Agency (FEMA), the U.S. Army Corps of Engineers (USACE), and various state agencies, provided post-storm documentation of coastal floods; however, neither strategy provided sufficient, timely information for emergency operations or to facilitate improvements in storm-tide and wave modeling and prediction.
SWaTH
Following Hurricane Sandy, the USGS began construction of an overland Surge, Wave, and Tide Hydrodynamics (SWaTH) Network along the Northeastern Atlantic Coast from North Carolina to Maine. This network, developed collaboratively with local, State, Tribal, and Federal agency partners, features the integration of long-term NOS and USGS real-time tide gages; mobile, rapidly deployable, but temporary, real-time gages (RDGs), and mobile storm-tide sensors (STSs). A central strategy enabling the effective use of SWaTH is that most locations for the mobile RDGs and STSs have been pre-surveyed to NGVD 1988 datums and equipped with receiving brackets that permit rapid installation of instrumentation in the hours and days prior to a storm. Following Hurricane Joaquin, the SWaTH Network has expanded to include additional sites in the Atlantic (South Carolina to Texas, Puerto Rico), Eastern Pacific (Washington to California), and Central Pacific (Hawaiian Islands).
SWaTH consists of flood-hardened, real-time telemetered tide gages, real-time telemetered RDGs, and pre-identified locations for STSs. The STSs will be deployed in three distinct but integrated network configurations consisting of (1) a distributed array of stations representing the range of landscape types and infrastructure subject to surge and wave forces, (2) along transects from the coastline through the inland resource of concern (e.g. a wetland or coastal community), and (3) at existing tide and river monitoring stations where new data can be integrated with long-term records.
The transects will provide data for the analysis of wave height, frequency, and devolution as functions of distance inland. Associated meteorological data, supplemental high water marks, coastal river flow gages, coastal current monitoring, and other hydrologic data will provide ancillary information for interpreting changes in coastal hydrology and vulnerability of coastal ecosystems and communities in response to storm damage.
USGS scientists Tim Pojunas and Jym Chapman install a rapid deployment gage (RDG) at Withers Swash at South Ocean Blvd. near Myrtle Beach, SC. The RDG measures water-surface elevation and various meteorological parameters and transmits the data in real-time.
Improvements
Despite the utility of the SWaTH network, crucial gaps in network coverage, reporting frequency, and monitoring capabilities remain. SWaTH density is not uniform and areas of the South Atlantic and Gulf Coasts are monitored relatively lightly. Additional SWaTH sites are needed to monitor these areas that are routinely impacted by surge events. The USGS is also expanding the network to include portions of the west coast.
The vast bulk of SWaTH monitoring is conducted using low cost, self-logging water-level pressure transducers that do not transmit real-time data. The USGS is exploring new, low-power, low-cost data transmission technologies to augment and eventually replace the self-logging instruments.
To date, SWaTH has focused primarily on monitoring water-levels and waves, yet there is a need to better document and model both surge currents (the movement of vast quantities of water by wind driven surface drag and tides) and the impacts of surge-induced saltwater intrusion. The USGS is actively seeking to identify and deploy mobile water-quality monitoring devices, particularly conductivity sensors, to document the distribution and persistence of saltwater and its toxicity to coastal stream, estuarian, and wetland biota.
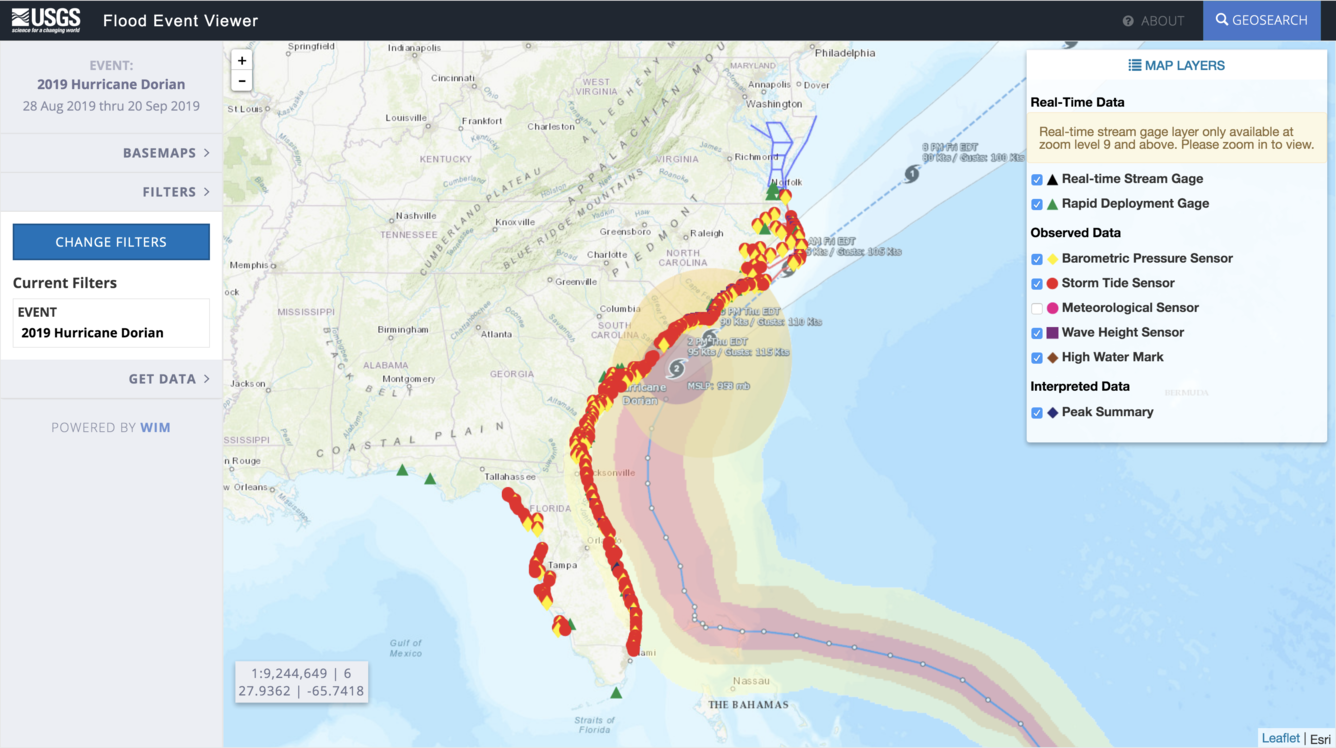
The Flood Event Viewer
Delivering these data rapidly and in an easily accessible manner is critical to emergency agencies and local emergency responders. SWaTH data deliverables will include times series information for water elevation, wave height and frequency, and selected meteorological data. These data are stored in a nation-wide database and made available via the USGS Flood Event Viewer, a mapping application and direct web services. These services are structured to allow other agencies to directly use the data as it is collected and approved during, or shortly following, a flood event.
During major storms or other short-term events, the USGS collects streamflow and additional data to help document high-water events. This data is uploaded to the Short-Term Network (STN) for long-term archival and served out to the public through the Flood Event Viewer (FEV) which provides convenient, map-based access to downloadable event-based data.
Providing Major Storm and Short-Term Flood Event Data
During major storms or other short-term events, the USGS collects streamflow and additional data to help document high-water events. This data is uploaded to the Short-Term Network (STN) for long-term archival and served out to the public through the Flood Event Viewer (FEV) which provides convenient, map-based access to downloadable event-based data.
The USGS provides practical, unbiased information about the Nation's rivers and streams that is crucial in mitigating hazards associated with floods. This site provides information about the USGS activities, data, and services provided during regional high-flow events, such as hurricanes or multi-state flooding events. The USGS response to these events is typically managed by the National Flood...
The USGS provides practical, unbiased information about the Nation's rivers and streams that is crucial in mitigating hazards associated with floods. This site provides information about the USGS activities, data, and services provided during regional high-flow events, such as hurricanes or multi-state flooding events. The USGS response to these events is typically managed by the National Flood...
USGS Storm Tide Sensors: Measuring Coastal Storm Tide and Flooding
USGS Storm Tide Sensors are specialized scientific instruments used to measure the depth and duration of storm surge during coastal storms. The data these sensors collect before, during and after a storm will help public officials assess storm damage, and improve computer models used to forecast storm surge and coastal change.
USGS Storm Tide Sensors are specialized scientific instruments used to measure the depth and duration of storm surge during coastal storms. The data these sensors collect before, during and after a storm will help public officials assess storm damage, and improve computer models used to forecast storm surge and coastal change.
Before a hurricane, USGS Scientists undertake a data collection effort of a grand scale. They install a temporary mobile network of sensors along the coasts to collect additional data on the intensity of storm surge, one of the most dangerous elements of a hurricane.
Before a hurricane, USGS Scientists undertake a data collection effort of a grand scale. They install a temporary mobile network of sensors along the coasts to collect additional data on the intensity of storm surge, one of the most dangerous elements of a hurricane.
The U.S. Geological Survey (USGS) deployed a temporary monitoring network of water-level and barometric pressure sensors at 224 locations along the Atlantic coast from Virginia to Maine to continuously record the timing, areal extent, and magnitude of hurricane storm tide and coastal flooding generated by Hurricane Sandy. These records were greatly supplemented by an extensive post-flood...
Authors
Brian E. McCallum, Shaun Wicklein, Robert G. Reiser, Ronald Busciolano, Jonathan Morrison, Richard J. Verdi, Jaime A. Painter, Eric R. Frantz, Anthony J. Gotvald
The U.S. Geological Survey (USGS) deployed a temporary monitoring network of water-level sensors at 212 locations along the Atlantic coast from South Carolina to Maine during August 2011 to record the timing, areal extent, and magnitude of inland hurricane storm tide and coastal flooding generated by Hurricane Irene. Water-level sensor locations were selected to augment existing tide...
Authors
Brian E. McCallum, Jaime A. Painter, Eric R. Frantz
The U.S. Geological Survey (USGS) deployed a temporary monitoring network of water-level and barometric pressure sensors at 127 locations along the gulf coast from Alabama to Louisiana to record the timing, areal extent, and magnitude of hurricane storm tide and coastal flooding generated by Hurricane Isaac. This deployment was undertaken as part of a coordinated federal emergency...
Authors
Brian E. McCallum, Benton D. McGee, Dustin R. Kimbrow, Michael S. Runner, Jaime A. Painter, Eric R. Frantz, Anthony J. Gotvald
Flood‐inundation data are most useful for decision makers when presented in the context of maps of affected communities and (or) areas. But because the data are scarce and rarely cover the full extent of the flooding, interpolation and extrapolation of the information are needed. Many geographic information systems provide various interpolation tools, but these tools often ignore the...
The U.S. Geological Survey (USGS) deployed a temporary monitoring network of 117 pressure transducers (sensors) at 65 sites over an area of about 5,000 square miles to record the timing, areal extent, and magnitude of inland hurricane storm surge and coastal flooding generated by Hurricane Ike, which struck southeastern Texas and southwestern Louisiana September 12-13, 2008. Fifty-six...
On August 29-31, 2008, the U.S. Geological Survey (USGS) deployed a mobile monitoring network consisting of 124 pressure transducers (sensors) (figs. 1, 2) at 80 sites over an area of about 4,200 square miles to record the timing, extent, and magnitude of inland hurricane storm surge and coastal flooding generated by Hurricane Gustav, which made landfall in southeastern Louisiana on...
Authors
Benton D. McGee, Burl B. Goree, Roland W. Tollett, Mason
Temporary monitoring stations employing non-vented pressure transducers were used to augment an existing U.S. Geological Survey coastal monitoring network to document the inland water levels related to the storm tide of Hurricane Wilma on the southwestern coast of Florida. On October 22, 2005, an experimental network consisting of 30 temporary stations was deployed over 90 miles of...
Pressure transducers and high-water marks were used to document the inland water levels related to storm surge generated by Hurricane Rita in southwestern Louisiana and southeastern Texas. On September 22-23, 2005, an experimental monitoring network consisting of 47 pressure transducers (sensors) was deployed at 33 sites over an area of about 4,000 square miles to record the timing...
Authors
Benton D. McGee, Burl B. Goree, Roland W. Tollett, Brenda K. Woodward, Wade H. Kress
Pressure transducers (sensors) and high-water marks were used to document the inland water levels related to storm surge generated by Hurricane Rita in southwestern Louisiana and southeastern Texas. On September 22-23, 2005, an experimental monitoring network of sensors was deployed at 33 sites over an area of about 4,000 square miles to record the timing, extent, and magnitude of inland...
During major storms or other short-term events, the USGS collects streamflow and additional data (including storm tide, wave height, high-water marks, and additional sensor deployments) to aid in documenting flood events. The USGS Flood Event Viewer provides convenient, map-based access to downloadable event-based data.
During large coastal storms, the storm surge and waves are the main cause of destruction and landscape change, transporting saline water, sediment, and debris inland. The USGS, in collaboration with stakeholders, has constructed a national Surge, Wave, and Tide Hydrodynamics (SWaTH) Network for the Atlantic, Eastern Pacific, and Central Pacific. SWaTH monitors and documents the height, extent, and timing of storm surge.
USGS hydrographer Keith Lambert installs a rapid deployment gage at New Mill Creek at Chesapeake, VA, in advance of Hurricane Dorian. (Credit: Blake Dudding, USGS)
Scientific information, if reliably obtained and wisely applied, can strengthen our efforts to build resilient coastal communities before storms strike, and guide our response and recovery strategies. Past storms have shown that storm surge and waves are the primary drivers of coastal-community destruction and dramatic changes in the coastal and near-coastal environment. The energy of the surge and accompanying waves cause physical changes to the landscape. The landward extent of the surge (storm tide) transports saline water, sediment, and debris to constructed and ecologically sensitive environments that are, otherwise, rarely impacted by direct ocean waters. As we develop more effective coastal-management approaches, we have the opportunity to build on our experience and knowledge to prepare for and minimize risks from future storms. Documenting the height, extent, and timing of storm surge and understanding how overland storm tide and waves evolve and dissipate when they move across natural and man-made landscapes, is critical for improved storm-surge modeling. That in turn, will promote coastal resilience, facilitate better planning, and provide more effective early warning of storm-driven flooding.
Background
For decades, the USGS has provided critical information on near-shore storm hydrodynamics for decisions regarding emergency response and resource allocation before, during, and immediately after landfall of hurricanes and nor’easters. Much of this information was provided via a few real-time tide gages focused on near-shore waters that supplemented and extended the National Oceanographic and Atmospheric Administration’s (NOAA) National Ocean Service (NOS) tide-gage network. In addition, data from temporary sensors and high-water marks occasionally obtained by the USGS in cooperation with the Federal Emergency Management Agency (FEMA), the U.S. Army Corps of Engineers (USACE), and various state agencies, provided post-storm documentation of coastal floods; however, neither strategy provided sufficient, timely information for emergency operations or to facilitate improvements in storm-tide and wave modeling and prediction.
SWaTH
Following Hurricane Sandy, the USGS began construction of an overland Surge, Wave, and Tide Hydrodynamics (SWaTH) Network along the Northeastern Atlantic Coast from North Carolina to Maine. This network, developed collaboratively with local, State, Tribal, and Federal agency partners, features the integration of long-term NOS and USGS real-time tide gages; mobile, rapidly deployable, but temporary, real-time gages (RDGs), and mobile storm-tide sensors (STSs). A central strategy enabling the effective use of SWaTH is that most locations for the mobile RDGs and STSs have been pre-surveyed to NGVD 1988 datums and equipped with receiving brackets that permit rapid installation of instrumentation in the hours and days prior to a storm. Following Hurricane Joaquin, the SWaTH Network has expanded to include additional sites in the Atlantic (South Carolina to Texas, Puerto Rico), Eastern Pacific (Washington to California), and Central Pacific (Hawaiian Islands).
SWaTH consists of flood-hardened, real-time telemetered tide gages, real-time telemetered RDGs, and pre-identified locations for STSs. The STSs will be deployed in three distinct but integrated network configurations consisting of (1) a distributed array of stations representing the range of landscape types and infrastructure subject to surge and wave forces, (2) along transects from the coastline through the inland resource of concern (e.g. a wetland or coastal community), and (3) at existing tide and river monitoring stations where new data can be integrated with long-term records.
The transects will provide data for the analysis of wave height, frequency, and devolution as functions of distance inland. Associated meteorological data, supplemental high water marks, coastal river flow gages, coastal current monitoring, and other hydrologic data will provide ancillary information for interpreting changes in coastal hydrology and vulnerability of coastal ecosystems and communities in response to storm damage.
USGS scientists Tim Pojunas and Jym Chapman install a rapid deployment gage (RDG) at Withers Swash at South Ocean Blvd. near Myrtle Beach, SC. The RDG measures water-surface elevation and various meteorological parameters and transmits the data in real-time.
Improvements
Despite the utility of the SWaTH network, crucial gaps in network coverage, reporting frequency, and monitoring capabilities remain. SWaTH density is not uniform and areas of the South Atlantic and Gulf Coasts are monitored relatively lightly. Additional SWaTH sites are needed to monitor these areas that are routinely impacted by surge events. The USGS is also expanding the network to include portions of the west coast.
The vast bulk of SWaTH monitoring is conducted using low cost, self-logging water-level pressure transducers that do not transmit real-time data. The USGS is exploring new, low-power, low-cost data transmission technologies to augment and eventually replace the self-logging instruments.
To date, SWaTH has focused primarily on monitoring water-levels and waves, yet there is a need to better document and model both surge currents (the movement of vast quantities of water by wind driven surface drag and tides) and the impacts of surge-induced saltwater intrusion. The USGS is actively seeking to identify and deploy mobile water-quality monitoring devices, particularly conductivity sensors, to document the distribution and persistence of saltwater and its toxicity to coastal stream, estuarian, and wetland biota.
The Flood Event Viewer
Delivering these data rapidly and in an easily accessible manner is critical to emergency agencies and local emergency responders. SWaTH data deliverables will include times series information for water elevation, wave height and frequency, and selected meteorological data. These data are stored in a nation-wide database and made available via the USGS Flood Event Viewer, a mapping application and direct web services. These services are structured to allow other agencies to directly use the data as it is collected and approved during, or shortly following, a flood event.
During major storms or other short-term events, the USGS collects streamflow and additional data to help document high-water events. This data is uploaded to the Short-Term Network (STN) for long-term archival and served out to the public through the Flood Event Viewer (FEV) which provides convenient, map-based access to downloadable event-based data.
Providing Major Storm and Short-Term Flood Event Data
During major storms or other short-term events, the USGS collects streamflow and additional data to help document high-water events. This data is uploaded to the Short-Term Network (STN) for long-term archival and served out to the public through the Flood Event Viewer (FEV) which provides convenient, map-based access to downloadable event-based data.
The USGS provides practical, unbiased information about the Nation's rivers and streams that is crucial in mitigating hazards associated with floods. This site provides information about the USGS activities, data, and services provided during regional high-flow events, such as hurricanes or multi-state flooding events. The USGS response to these events is typically managed by the National Flood...
The USGS provides practical, unbiased information about the Nation's rivers and streams that is crucial in mitigating hazards associated with floods. This site provides information about the USGS activities, data, and services provided during regional high-flow events, such as hurricanes or multi-state flooding events. The USGS response to these events is typically managed by the National Flood...
USGS Storm Tide Sensors: Measuring Coastal Storm Tide and Flooding
USGS Storm Tide Sensors are specialized scientific instruments used to measure the depth and duration of storm surge during coastal storms. The data these sensors collect before, during and after a storm will help public officials assess storm damage, and improve computer models used to forecast storm surge and coastal change.
USGS Storm Tide Sensors are specialized scientific instruments used to measure the depth and duration of storm surge during coastal storms. The data these sensors collect before, during and after a storm will help public officials assess storm damage, and improve computer models used to forecast storm surge and coastal change.
Before a hurricane, USGS Scientists undertake a data collection effort of a grand scale. They install a temporary mobile network of sensors along the coasts to collect additional data on the intensity of storm surge, one of the most dangerous elements of a hurricane.
Before a hurricane, USGS Scientists undertake a data collection effort of a grand scale. They install a temporary mobile network of sensors along the coasts to collect additional data on the intensity of storm surge, one of the most dangerous elements of a hurricane.
The U.S. Geological Survey (USGS) deployed a temporary monitoring network of water-level and barometric pressure sensors at 224 locations along the Atlantic coast from Virginia to Maine to continuously record the timing, areal extent, and magnitude of hurricane storm tide and coastal flooding generated by Hurricane Sandy. These records were greatly supplemented by an extensive post-flood...
Authors
Brian E. McCallum, Shaun Wicklein, Robert G. Reiser, Ronald Busciolano, Jonathan Morrison, Richard J. Verdi, Jaime A. Painter, Eric R. Frantz, Anthony J. Gotvald
The U.S. Geological Survey (USGS) deployed a temporary monitoring network of water-level sensors at 212 locations along the Atlantic coast from South Carolina to Maine during August 2011 to record the timing, areal extent, and magnitude of inland hurricane storm tide and coastal flooding generated by Hurricane Irene. Water-level sensor locations were selected to augment existing tide...
Authors
Brian E. McCallum, Jaime A. Painter, Eric R. Frantz
The U.S. Geological Survey (USGS) deployed a temporary monitoring network of water-level and barometric pressure sensors at 127 locations along the gulf coast from Alabama to Louisiana to record the timing, areal extent, and magnitude of hurricane storm tide and coastal flooding generated by Hurricane Isaac. This deployment was undertaken as part of a coordinated federal emergency...
Authors
Brian E. McCallum, Benton D. McGee, Dustin R. Kimbrow, Michael S. Runner, Jaime A. Painter, Eric R. Frantz, Anthony J. Gotvald
Flood‐inundation data are most useful for decision makers when presented in the context of maps of affected communities and (or) areas. But because the data are scarce and rarely cover the full extent of the flooding, interpolation and extrapolation of the information are needed. Many geographic information systems provide various interpolation tools, but these tools often ignore the...
The U.S. Geological Survey (USGS) deployed a temporary monitoring network of 117 pressure transducers (sensors) at 65 sites over an area of about 5,000 square miles to record the timing, areal extent, and magnitude of inland hurricane storm surge and coastal flooding generated by Hurricane Ike, which struck southeastern Texas and southwestern Louisiana September 12-13, 2008. Fifty-six...
On August 29-31, 2008, the U.S. Geological Survey (USGS) deployed a mobile monitoring network consisting of 124 pressure transducers (sensors) (figs. 1, 2) at 80 sites over an area of about 4,200 square miles to record the timing, extent, and magnitude of inland hurricane storm surge and coastal flooding generated by Hurricane Gustav, which made landfall in southeastern Louisiana on...
Authors
Benton D. McGee, Burl B. Goree, Roland W. Tollett, Mason
Temporary monitoring stations employing non-vented pressure transducers were used to augment an existing U.S. Geological Survey coastal monitoring network to document the inland water levels related to the storm tide of Hurricane Wilma on the southwestern coast of Florida. On October 22, 2005, an experimental network consisting of 30 temporary stations was deployed over 90 miles of...
Pressure transducers and high-water marks were used to document the inland water levels related to storm surge generated by Hurricane Rita in southwestern Louisiana and southeastern Texas. On September 22-23, 2005, an experimental monitoring network consisting of 47 pressure transducers (sensors) was deployed at 33 sites over an area of about 4,000 square miles to record the timing...
Authors
Benton D. McGee, Burl B. Goree, Roland W. Tollett, Brenda K. Woodward, Wade H. Kress
Pressure transducers (sensors) and high-water marks were used to document the inland water levels related to storm surge generated by Hurricane Rita in southwestern Louisiana and southeastern Texas. On September 22-23, 2005, an experimental monitoring network of sensors was deployed at 33 sites over an area of about 4,000 square miles to record the timing, extent, and magnitude of inland...
During major storms or other short-term events, the USGS collects streamflow and additional data (including storm tide, wave height, high-water marks, and additional sensor deployments) to aid in documenting flood events. The USGS Flood Event Viewer provides convenient, map-based access to downloadable event-based data.