
Finding areas of compatibility between renewable energy development and conservation of the Nation’s resources
Energy development and resource conservation can seem at odds with one another, but a recent study highlights how to minimize conflict and evaluate tradeoffs.

Seeking Responsible Development
Transitioning from reliance on carbon-based energy sources to renewable-energy sources as a means of mitigating climate change will require greater development of renewable energy facilities. Development of renewable energy is a priority for the Department of the Interior, but so is land and water conservation that ensures that natural resources are sustained for future generations. Some of the unintended consequences of energy facilities include wildlife habitat degradation leading to displacement of bird species and mortality to birds and bats (Shaffer and Buhl, 2016; Martin et al., 2017; Conkling et al., 2022). Thus, efforts to transition to higher dependence on renewable-energy sources, while still protecting the Nations’ natural resources, will require tradeoffs in land management priorities.
The Research Question
A USGS-led study asked whether compatibility can be found between the two priorities of increasing renewable-energy capacity and conserving the Nation’s lands and waters. Specifically, the study asked: “What is the amount of land available for building renewable-energy infrastructure while also considering the habitat requirements of bird species and protecting the best habitat for them?” This framework, a model developed in collaboration with the U.S. Fish and Wildlife Service and WEST, Inc., allows the user to evaluate tradeoffs in the face of potential land scarcity owing to increased build-out of energy infrastructure and other human developments, against the need and desire to protect the Nation’s resources.
The Model and Results
The model was developed for the northern Great Plains, a region with both high renewable energy potential and high ecological value. It was designed to demonstrate a method but not to be a prescriptive facility siting tool that indicates where and where not to build energy infrastructure. The model applies the energy-siting regulations of the North Dakota Century Code (NDCC) because the regulations are well defined and fit well into a mappable framework. For example, the NDCC excludes land from energy development that is within proscribed setback distances of human infrastructure. These include transportation corridors (such as airports and roads and their rights-of-way), powerline transmission corridors, and human occupations. The NDCC also excludes public land, large bodies of water, and designated critical habitat for threatened and endangered species (TES). The land base that is excluded from energy development by these regulations (referred to as “Regulated Land”) was quantified (Fig. 1). The remaining land base was referred to as “Not Regulated Land” and represents the land base that may be available for future energy development or for some other societally driven purpose, like conservation.
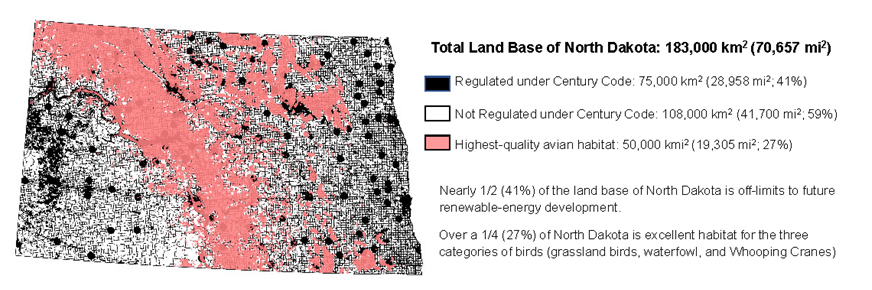
Visual depiction of the amount of “Regulated” and “Not Regulated Land” in North Dakota. Black areas represent the State’s land base that is unavailable for future renewable-energy development based on the North Dakota Century Code.(75,000km² / 28,958 mi², 41%) White areas represent the land base theoretically available for future renewable-energy development or other societally approved land uses. (108,000 km² / 41,700 mi², 59%) Pink areas represent the highest-quality habitat for 3 categories of birds. (50,000km²/ 19,305 mi², 27%) This visual allows one to see where potential conflicts and tradeoffs may occur between future energy development and future avian-conservation efforts. The model predicts minimal conflict between energy development and avian-conservation efforts for an area representing about 54% of the “Not Regulated Land.” Nearly 1/2 (41%) of the land base of North Dakota is off-limits to future renewable-energy development. Over 1/4 (27%) of North Dakota is excellent habitat for the three categories of birds (grassland, waterfowl, and Whooping Cranes).
For the sake of illustration, this article presents only the results for North Dakota. See Shaffer et al. (2022) for results that represent the study’s entire project area. For North Dakota, the model predicted that 75,000 km2 (41%) of the State’s total land base of 183,000 km2 falls under the category of ‘Regulated Land’ and is unavailable for future development of energy infrastructure (Fig. 1). Alternatively, 108,000 km2 (59%) of the State’s land base is ‘Not Regulated Land’. The value of 41% may seem high for a State with a low human-population density relative to land area, but existing anthropogenic infrastructure is prevalent.
In the northern Great Plains, conservation actions focus on maintaining the intactness of native grasslands and wetlands because they support high numbers of breeding and migrating bird species. Energy developers typically employ an “avoidance-first” wildlife mitigation strategy, in which they try to avoid known negative impacts to wildlife. Thus, the model identified the highest-quality breeding or migration habitat for 3 categories of birds:
- selected species of grassland-nesting waterfowl
- selected species of grassland-nesting birds, and
- the Whooping Crane (Grus americana)
The highest-quality habitat for the three avian categories is mapped to enable the visualization of this area relative to the area of land that is Regulated (black) and Not Regulated (white) (Fig. 1). Figure 1 allows one to see where potential conflicts and tradeoffs may occur between future energy development and future avian-conservation efforts. The model predicted that 50,000 km2 (27%) of the North Dakota land base harbored the highest-quality habitat for the 3 focal bird categories (Fig. 1). Considering just “Not Regulated” land (the portion theoretically available for development or other societally approved land uses) for bird habitat conservation, 50,000 km2 of high-quality habitat represents 46 percent of the land that could also be theoretically developed for renewable energy. In other words, the model predicts that there would be no conflict between energy development and avian-conservation efforts for an area representing about 54 percent of the “Not Regulated Land.”

Recognizing that the feasibility of undertaking conservation activities for a quarter of a State’s land base is likely to be low, the model provides for more realistic scenarios. The model incorporated the use of Venn diagrams to discern areas where highest-quality habitat overlaps between and among the 3 focal avian categories. Areas of overlap indicate where conservation activities for one focal avian group will also benefit another group. For example, if the most realistic scenario was to conserve the area in which the 3 groups overlap, that would be the 1,296 km2 indicated by W:GB:WC in Figure 2. This value represents only 3% of the State’s total land base. The application of Venn diagrams allows one to visualize the relative amounts of a State’s land base that would be involved in conservation actions under differing strategies of which avian group or groups to prioritize.
Similar results are presented in Shaffer et al. (2022) for the multi-State area to which the model applied, which included North Dakota, South Dakota, and portions of Montana, Minnesota, and Iowa.
In summary, this USGS-led study illustrated how interested parties can quantify the land base available for development while also maximizing the protection of a natural resource by identifying those areas of overlap of focal species’ highest-quality habitat. In this way, the total land base “removed” for species’ protection is minimized. This exercise could be emulated for other species or other focal taxa. In addition, the model could be applied to the interests of different subsets of societal interest groups (for example, agricultural producers who want to identify the highest-producing cropland) so that one can demonstrate how much land base is available for future renewable energy development versus available for other societal land uses. This exercise illustrates tradeoffs and increasingly difficult decisions that society will have to make regarding how to use a shrinking land base.
References
Conkling, T.J., Vander Zanden, H.B., Allison, T.D., Diffendorfer, J.E., Dietsch, T.V., Duerr, A.E., Fesnock, A.L., Hernandez, R.R., Loss, S.R., Nelson, D.M., Sanzenbacher, P.M., Yee, J.L., and Katzner, T.E., 2022, Vulnerability of avian populations to renewable energy production: Royal Society Open Science, Vol. 9:211558. https://doi.org/10.1098/rsos.211558.
Martin, C.M., Arnett, E.B., Stevens, R.D., and Wallace, M.C., 2017, Reducing bat fatalities at wind facilities while improving the economic efficiency of operational mitigation: Journal of Mammalogy, v., 98, no. 2., p. 378–385. https://doi.org/10.1093/jmammal/gyx005.
Shaffer, J.A., and Buhl, D.A., 2016, Effects of wind-energy facilities on breeding grassland bird distributions: Conservation Biology, v. 30, no. 1, p. 59–71. https://doi.org/10.1111/cobi.12569.
Shaffer, J.A., Niemuth, N.D., Loesch, C.R., Derby, C.E., Pearse, A.T., Barnes, K.W., Shaffer, T.L., and Ryba, A.J., 2022, Limited land base and competing land uses force societal tradeoffs when siting energy development: Journal of Fish and Wildlife Management, v. 13, no. 1, p. 106–123; e1944-687X. https://doi.org/10.3996/JFWM-21-036.