U.S. flag

An official website of the United States government

Images

Pacific Coastal and Marine Science Center images.

Filter Total Items: 1369
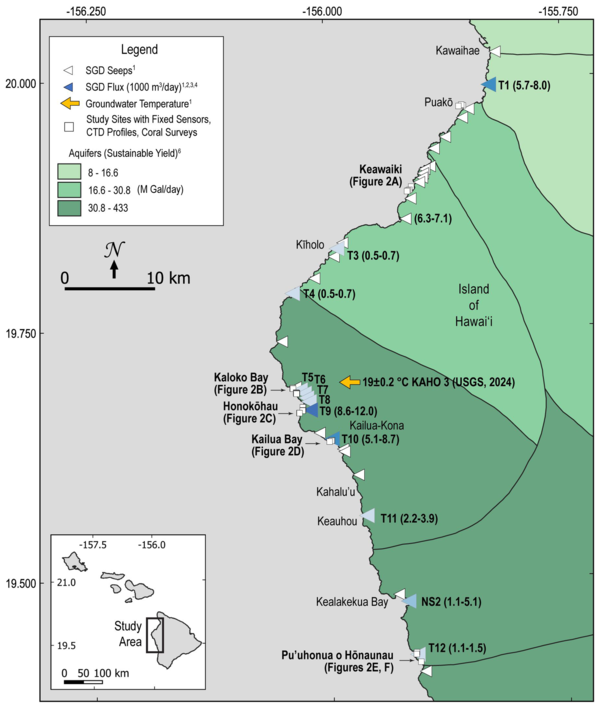
Map showing locations of mapped groundwater seeps in western Big Island, Hawaii

Map showing locations of mapped groundwater seeps (white triangles), estimated fluxes of submarine groundwater discharge (blue triangles), groundwater temperature (orange arrow), and study sites (white squares) from the study Submarine groundwater discharge creates

Chart showing extreme 2-year water levels in SF Bay under four scenarios
Extreme 2-year water levels in SF Bay under baseline; restoration; urban; and combined scenarios at current versus 1.5 m SLR

Extreme 2-year water levels in SF Bay under baseline; restoration; urban; and combined scenarios at current versus 1.5 m SLR. From the study Mitigating Flood Risks in Urban Estuaries: Tidal Dynamics, Shoreline Hardening, Nature-Based Solutions, and Floodgates in San Francisco Bay.

Photos of the autonomous MAPCAT cataraft being tested on a lake
Photos of the autonomous MAPCAT cataraft being tested

The Autonomous MAPping CATaraft, or “Autonomous MAPCAT”, is a remotely controlled, 14 foot long by 7 foot wide boat, built from an inflatable pontoon, aluminum frame, whitewater cataraft.

Collage of images showing natural offshore oil seepage on the California Coastline
Figure showing surface of the Whales Tail Marsh colored to segment
Surface of the Whales Tail Marsh colored to segment by the presumed body of water that inundates the given regions of the marsh

 Surface of the Whales Tail Marsh colored to segment by the presumed body of water that inundates the given regions of the marsh. From the study Comparison of creek and bay influences on salt marsh sediment budget and deposition patterns.

Detailed map showing seafloor features such as submarine canyons and slope failures offshore Kodiak Island, Alaska
Diagram showing Electrical Resistivity Tomography profiles at Ofu, American Samoa
Electrical Resistivity Tomography profiles at Ofu, American Samoa

Electrical Resistivity Tomography (ERT) profiles at: (A) Papaloloa Point Center (shore perpendicular), (B) Papaloloa Point Center (shore parallel), (C) Papaloloa Point East, and (D) Fattuana Point.

Electrical Resistivity Tomography (ERT) profiles at: (A) Papaloloa Point Center (shore perpendicular), (B) Papaloloa Point Center (shore parallel), (C) Papaloloa Point East, and (D) Fattuana Point.

Diagram showing Geophysical and geochemical data collected at Papaloloa Point, Ofu, American Samoa
Geophysical and geochemical data collected at Papaloloa Point, Ofu, American Samoa

Geophysical and geochemical data at Papaloloa Point. (A) Aerial thermal infrared data (± 5°C). (B) Alongshore YSI salinity plot with relative location of radon buoy alongshore (+).

Detailed map of BeachX, Curl Curl Beach, New South Wales, Australia

Location of BeachX. Inset wave rose shows the location and distribution of offshore waves from ERA5. b The detailed map of BeachX (Curl Curl Beach, New South Wales, Australia). The color gradient at the seaside indicates bathymetry. Yellow lines represent transects. Red dots show the location of nearshore waves.

Location of BeachX. Inset wave rose shows the location and distribution of offshore waves from ERA5. b The detailed map of BeachX (Curl Curl Beach, New South Wales, Australia). The color gradient at the seaside indicates bathymetry. Yellow lines represent transects. Red dots show the location of nearshore waves.

Diagram showing six example sites around Oahu under different SLR scenarios
Six example sites around Oahu under different SLR scenarios

Six example sites around Oʻahu with forecasted vegetation line positions for the month of July, under 0.3–1.2 m (1 ft (black)—4 ft (yellow)) of SLR. Locations are labeled by number and common beach name, and oriented with North pointing upwards in every photo except for Kūʻau. Inset of Oʻahu has labels of approximate locations of the example sites.

Six example sites around Oʻahu with forecasted vegetation line positions for the month of July, under 0.3–1.2 m (1 ft (black)—4 ft (yellow)) of SLR. Locations are labeled by number and common beach name, and oriented with North pointing upwards in every photo except for Kūʻau. Inset of Oʻahu has labels of approximate locations of the example sites.

Predictions of 100-year storm surge return levels and associated 90% credible interval widths for the entire US coastline
BAYEX predictions of 100-year storm surge return levels and associated 90% credible interval widths for the entire US coastline

BAYEX predictions of 100-year storm surge return levels and associated 90% credible interval widths for the entire US coastline. From the study Observations reveal changing coastal storm extremes around the United States.

Collage showing three different coastlines
Banner image for Coastal Science Navigator

Banner image for the Coastal Science Navigator, an online gateway for users such as state and local planners, resources managers, consultants, and researchers to more easily gain access to USGS coastal science data, products, tools, and information.

Banner image for the Coastal Science Navigator, an online gateway for users such as state and local planners, resources managers, consultants, and researchers to more easily gain access to USGS coastal science data, products, tools, and information.

Charts depicting water flux through a tidal creek during flood and ebb tides

Water flux through a tidal creek with a small, moderate, and extreme tide range during (A) a flood tide and (B) an ebb tide. Creek velocity legend applies to all tide ranges.

Maps showing China Camp Marsh study area with inset showing suspended sediment measurements

Map of study area: China Camp State Park and the adjacent shallows of San Pablo Bay. Black and gray bathymetry lines indicate the location of mean higher high water (MHHW) and mean lower low water (MLLW), respectively. Elevations in meters of those tidal datums are referenced to the North American Vertical Datum of 1988

Map of study area: China Camp State Park and the adjacent shallows of San Pablo Bay. Black and gray bathymetry lines indicate the location of mean higher high water (MHHW) and mean lower low water (MLLW), respectively. Elevations in meters of those tidal datums are referenced to the North American Vertical Datum of 1988

Charts showing hydrodynamic and morphological responses to El Nino Southern Oscillation phases along North America West Coast
Hydrodynamic and morphological responses to El Nino Southern Oscillation phases along North America West Coast during winter 1997–2022
Map of the North American West Coast with charts showing hydrodynamic forcings and beach morphology states
Study area overview with hydrodynamic forcings and beach morphology states

Map of the North American West Coast, the monitored coastline is shown in light yellow. Dashed boxes delineate the different subregions of the study area. Pie charts show the regional distribution of advancing/retreating waterline trends during 2000–2022 derived from the dataset presented in this study.

Map of the North American West Coast, the monitored coastline is shown in light yellow. Dashed boxes delineate the different subregions of the study area. Pie charts show the regional distribution of advancing/retreating waterline trends during 2000–2022 derived from the dataset presented in this study.

Was this page helpful?