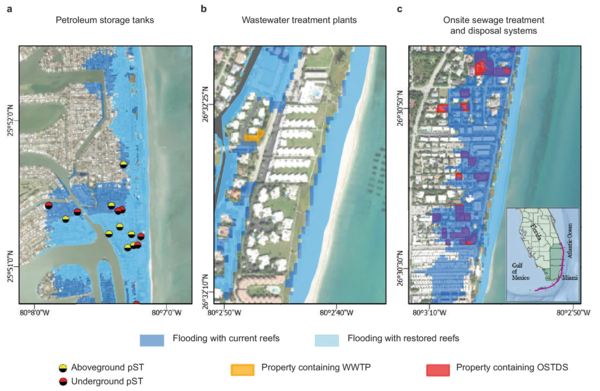
Santa Cruz wharf post-storm survey - Depth-tinted hillshade of survey area
Santa Cruz wharf post-storm survey - Depth-tinted hillshade of survey areaSanta Cruz wharf post-storm survey - Depth-tinted hillshade of survey area. Following the partial collapse of the Santa Cruz Municipal Wharf during January 2025 storms, the USGS Pacific Coastal and Marine Science Center was requested to help map seafloor debris by NOAA’s Monterey Bay National Marine Sanctuary.