Cover image for Marine Minerals b-roll - Manganese Nodules
Cover image for Marine Minerals b-roll - Manganese NodulesUnderwater footage of manganese nodules on seafloor, taken from a remotely operated vehicle.

Official websites use .gov
A .gov website belongs to an official government organization in the United States.
Secure .gov websites use HTTPS
A lock () or https:// means you’ve safely connected to the .gov website. Share sensitive information only on official, secure websites.
Pacific Coastal and Marine Science Center images.

Underwater footage of manganese nodules on seafloor, taken from a remotely operated vehicle.
Underwater footage of manganese nodules on seafloor, taken from a remotely operated vehicle.
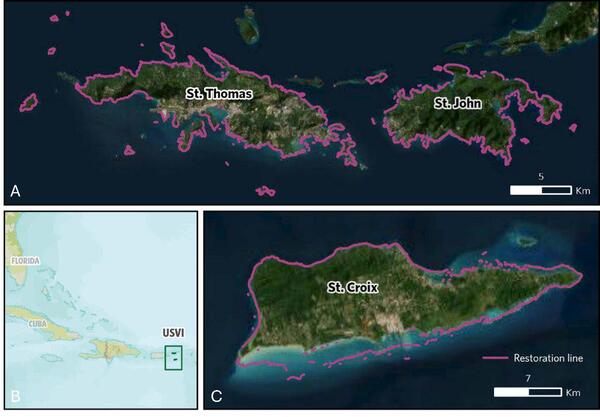
Study area for US Virgin Islands, from the study Quantifying the Coastal Hazard Risk Reduction Benefits of Coral Reef Restoration in the U.S. Virgin Islands.
Study area for US Virgin Islands, from the study Quantifying the Coastal Hazard Risk Reduction Benefits of Coral Reef Restoration in the U.S. Virgin Islands.
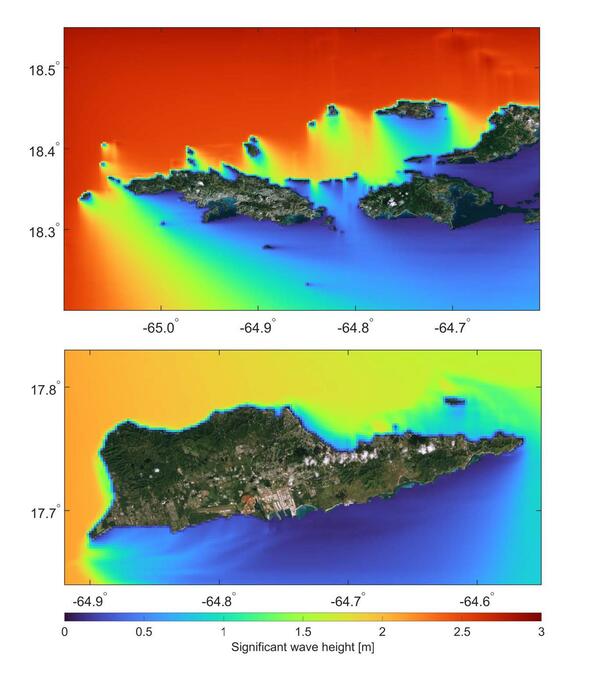
Maps showing output example for SWAN model for St Thomas and St Coix, US Virgin Islands, from the study Quantifying the Coastal Hazard Risk Reduction Benefits of Coral Reef Restoration in the U.S. Virgin Islands.
Maps showing output example for SWAN model for St Thomas and St Coix, US Virgin Islands, from the study Quantifying the Coastal Hazard Risk Reduction Benefits of Coral Reef Restoration in the U.S. Virgin Islands.
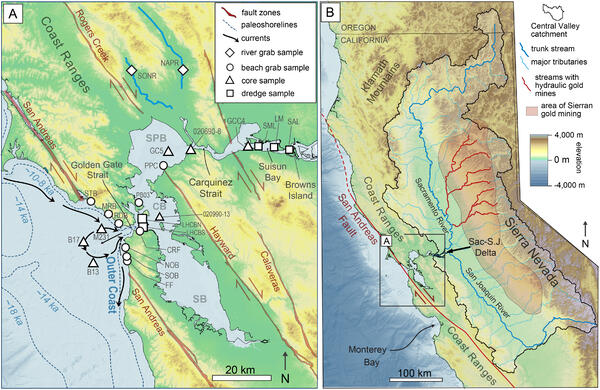
Overview map of the San Francisco Bay area with location and type of new samples reported in the study Reversal in estuarine sand supply driven by Holocene sea level rise: A model for sand transport in large structural estuaries, San Francisco Bay, California, USA.
Overview map of the San Francisco Bay area with location and type of new samples reported in the study Reversal in estuarine sand supply driven by Holocene sea level rise: A model for sand transport in large structural estuaries, San Francisco Bay, California, USA.
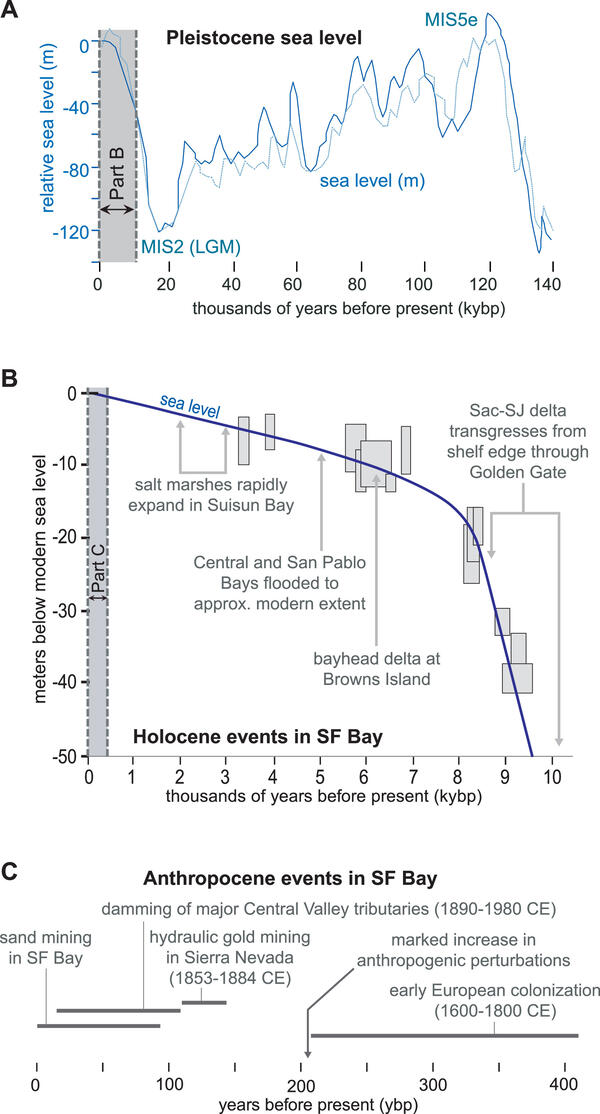
Pleistocene to Holocene chronology of the San Francisco (San Francisco) Bay region highlighting sea level fluctuations and anthropogenic events.
Pleistocene to Holocene chronology of the San Francisco (San Francisco) Bay region highlighting sea level fluctuations and anthropogenic events.
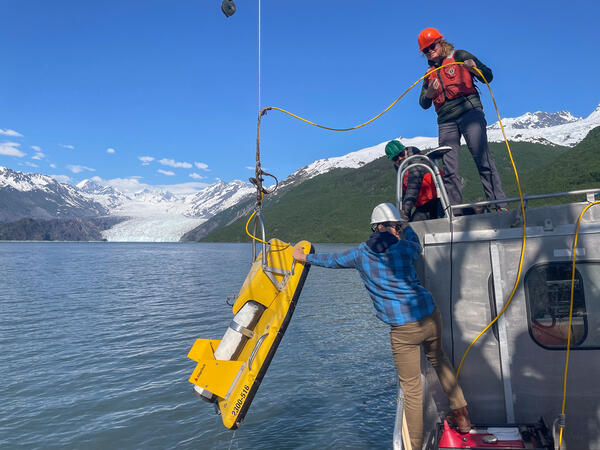
Scientists deploying a chirp sub-bottom profiler in Prince William Sound, Alaska, as part of the USGS Coastal and Marine Geohazards of the U.S. West Coast and Alaska project.
Scientists deploying a chirp sub-bottom profiler in Prince William Sound, Alaska, as part of the USGS Coastal and Marine Geohazards of the U.S. West Coast and Alaska project.
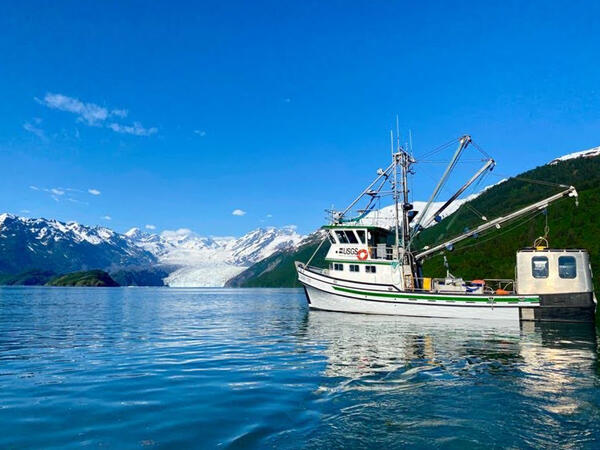
Research Vessel Alaskan Gyre in Prince William Sound conducting Chirp and Sparker geophysical surveys to look for submarine landslide deposits, which are a major tsunami hazard in the fjord regions and also provide a record of large earthquake recurrence.
Research Vessel Alaskan Gyre in Prince William Sound conducting Chirp and Sparker geophysical surveys to look for submarine landslide deposits, which are a major tsunami hazard in the fjord regions and also provide a record of large earthquake recurrence.
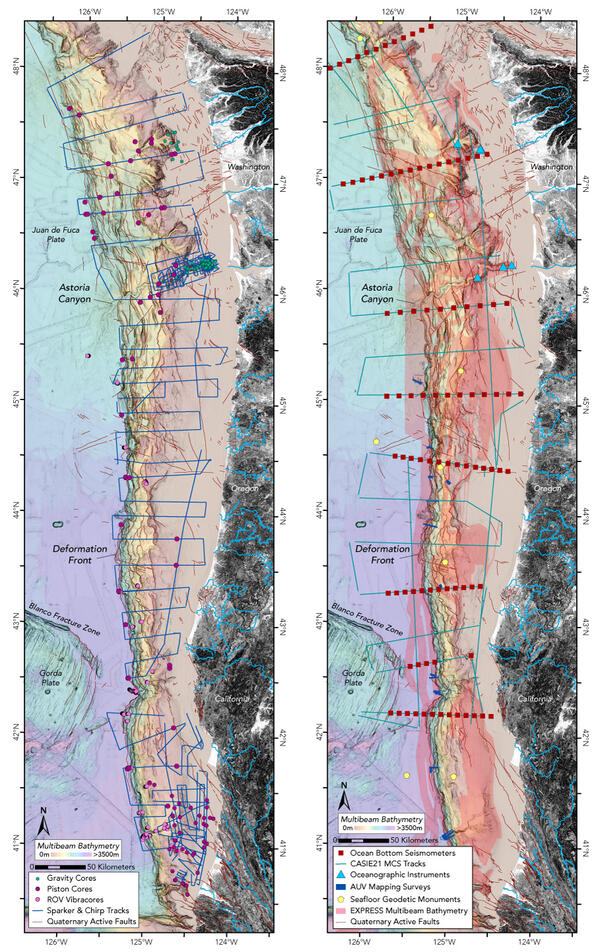
Updated in 2024, this index map of the U.S. Cascadia margin shows where data have been collected since 2018 as part of the Subduction Zone Marine Geohazards Project.
Updated in 2024, this index map of the U.S. Cascadia margin shows where data have been collected since 2018 as part of the Subduction Zone Marine Geohazards Project.

Map showing location of major faults and offshore basins of the San Francisco area, from the study Vertical tectonic deformation associated with the San Andreas fault zone offshore of San Francisco, California.
Map showing location of major faults and offshore basins of the San Francisco area, from the study Vertical tectonic deformation associated with the San Andreas fault zone offshore of San Francisco, California.

Regional map of southern California showing the study region from Dana Point to La Jolla Cove.
Regional map of southern California showing the study region from Dana Point to La Jolla Cove.

Examples of invasive species likely to leave a fossil record: a, Asian clams at Teddington Lock on the River Thames, UK; b, Asian clams in the River Soar, Leicestershire, UK; c, quagga mussels revealed on the rocks lining Grafham Water reservoir, UK, during low water levels.; d, zebra mussels on a native freshwater clam in Manitoba, Canada; e, Himalayan balsam along
Examples of invasive species likely to leave a fossil record: a, Asian clams at Teddington Lock on the River Thames, UK; b, Asian clams in the River Soar, Leicestershire, UK; c, quagga mussels revealed on the rocks lining Grafham Water reservoir, UK, during low water levels.; d, zebra mussels on a native freshwater clam in Manitoba, Canada; e, Himalayan balsam along

Late 20th and 21st century production of avocados, coconuts, mangos, peach, walnut, palm kernels, snails and medium-density fiberboard.
Late 20th and 21st century production of avocados, coconuts, mangos, peach, walnut, palm kernels, snails and medium-density fiberboard.

A USGS researcher in a kayak tows instruments to measure water level and suspended-sediment concentration in Whale's Tail South marsh, San Francisco Bay, CA.
A USGS researcher in a kayak tows instruments to measure water level and suspended-sediment concentration in Whale's Tail South marsh, San Francisco Bay, CA.

Aerial orthomosaic photo of Whale's Tail Marsh south (WTMS) in May 2022 with marsh-edge boundary drawn in orange at elevation of the scarp head contour.
Aerial orthomosaic photo of Whale's Tail Marsh south (WTMS) in May 2022 with marsh-edge boundary drawn in orange at elevation of the scarp head contour.

Restored tidal marsh at the Nisqually River Delta within Billy Frank Jr. National Wildlife Refuge, Washington.
Restored tidal marsh at the Nisqually River Delta within Billy Frank Jr. National Wildlife Refuge, Washington.
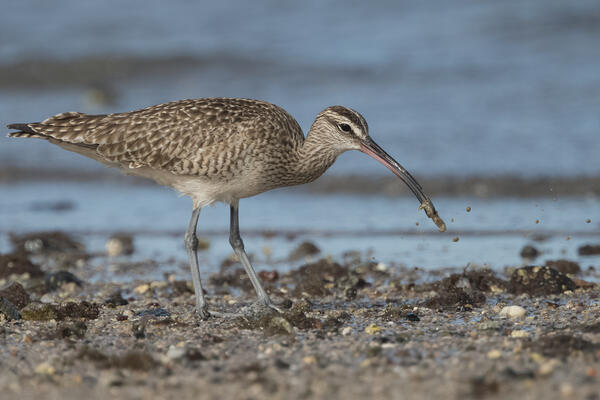
A whimbrel (a large shorebird) consuming a burrowing shrimp in an intertidal area.
A whimbrel (a large shorebird) consuming a burrowing shrimp in an intertidal area.

Sampling sites are color-coded by habitat. White labels indicate site names. Marsh sites: U1, Unit 1; U2, Unit 2; U3, Unit 3; U4, Unit 4; M, Madrone; P1, Phase 1 restoration; P2, Phase 2 restoration; RF, reference. For Marsh sites, the last letter indicates the position along a tidal channel: N, north; M, middle; S, south; W, west.
Sampling sites are color-coded by habitat. White labels indicate site names. Marsh sites: U1, Unit 1; U2, Unit 2; U3, Unit 3; U4, Unit 4; M, Madrone; P1, Phase 1 restoration; P2, Phase 2 restoration; RF, reference. For Marsh sites, the last letter indicates the position along a tidal channel: N, north; M, middle; S, south; W, west.

A semipalmated plover (a small shorebird) consuming a polychaete worm in an intertidal area.
A semipalmated plover (a small shorebird) consuming a polychaete worm in an intertidal area.

Screenshot of CoastSeg interface, from the study CoastSeg: an accessible and extendable hub for satellite-derived-shoreline (SDS) detection and mapping.
Screenshot of CoastSeg interface, from the study CoastSeg: an accessible and extendable hub for satellite-derived-shoreline (SDS) detection and mapping.

Satellite-derived shorelines for a barrier island east of Moses Point Fishing Village, Norton Sound, Alaska, from the study CoastSeg: an accessible and extendable hub for satellite-derived-shoreline (SDS) detection and mapping.
Satellite-derived shorelines for a barrier island east of Moses Point Fishing Village, Norton Sound, Alaska, from the study CoastSeg: an accessible and extendable hub for satellite-derived-shoreline (SDS) detection and mapping.

Satellite images of barrier island near Moses Point Fishing Village, Norton Sound, Alaska, taken in 1986 and 2023.
Satellite images of barrier island near Moses Point Fishing Village, Norton Sound, Alaska, taken in 1986 and 2023.