
Hurricane Harvey - Forecast and Documentation of Coastal Change
Hurricane Harvey coastal change forecast and pre- and post-storm photos documenting coastal change.
Hurricane Harvey impacted the Texas and Louisiana coasts from August 25-30, 2017. Storm surge reached 1 to 2 meters above predicted tides. Offshore wave heights in excess of 7 meters were observed near Corpus Christi. These large waves contributed an additional 1 to 3 meters of wave runup at the shoreline. The combined effects of surge and storm-induced wave runup created elevated total water levels at the shoreline, causing extensive erosion of the beach and dunes.
Response activities included:
Forecast of Potential Coastal Change
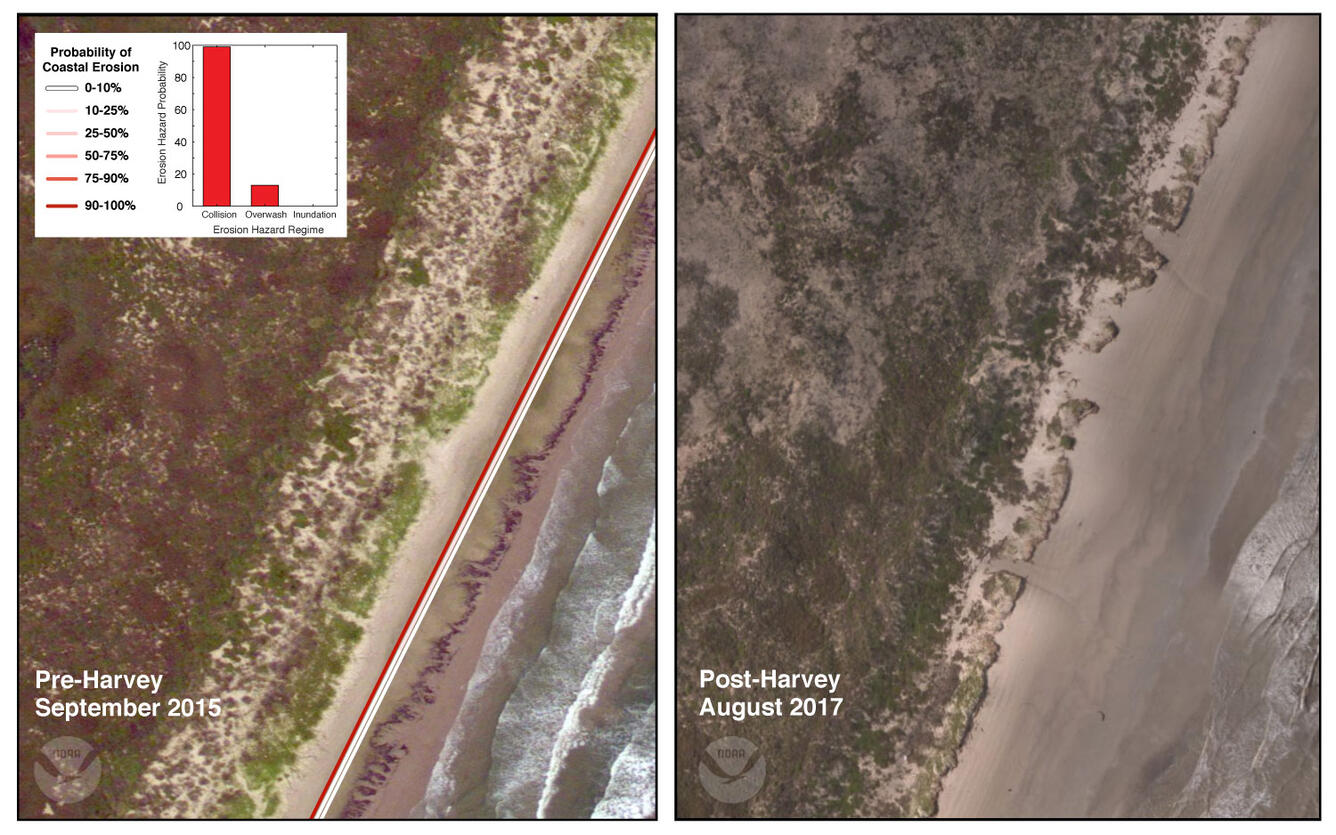
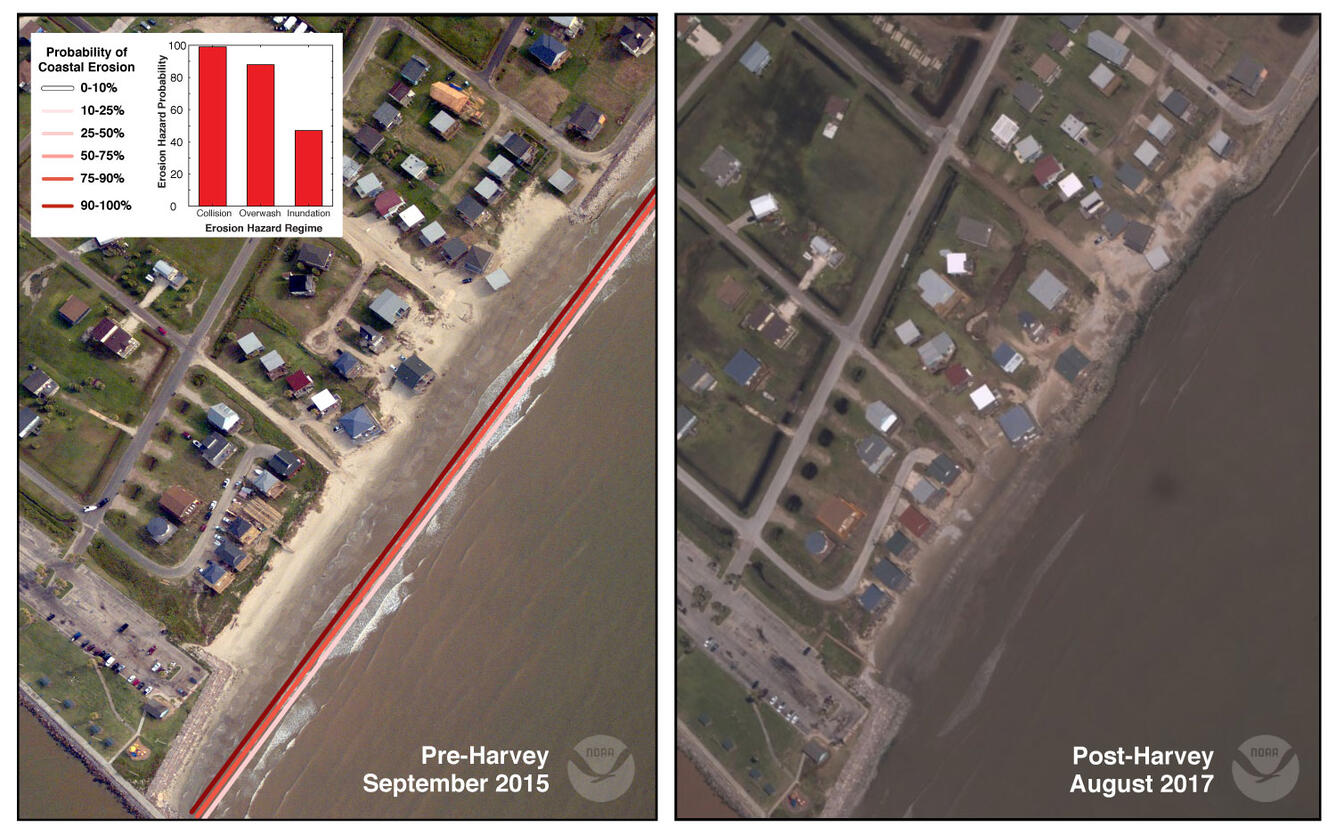
The coastal change forecast model predicts the probability of where and how primary sand dunes along the coast will be impacted by water levels during a storm. This includes the combined effect of surge and wave runup. The color band closest to the shoreline is the probability of dune erosion, the middle color band is the probability that sand dunes will be overtopped by waves during the storm, and the outer color band is the probability that the sand dunes will be completely inundated/flooded. The model forecast is available on the Coastal Change Hazards Portal and more information about the model can be found here: Scenario-Based Assessments for Coastal Change Hazard Forecasts.

Pre-and Post-Storm Photo Comparisons
The photo pairs below show aerial photos from September 2015 and similar imagery taken a few days after Hurricane Harvey's landfall. The photos show how the coast was impacted by the storm and are used to validate the forecast model.
Research is part of the National Assessment of Storm-Induced Coastal Change Hazards project.


Hurricane Harvey coastal change forecast and pre- and post-storm photos documenting coastal change.
Hurricane Harvey impacted the Texas and Louisiana coasts from August 25-30, 2017. Storm surge reached 1 to 2 meters above predicted tides. Offshore wave heights in excess of 7 meters were observed near Corpus Christi. These large waves contributed an additional 1 to 3 meters of wave runup at the shoreline. The combined effects of surge and storm-induced wave runup created elevated total water levels at the shoreline, causing extensive erosion of the beach and dunes.
Response activities included:
Forecast of Potential Coastal Change
The coastal change forecast model predicts the probability of where and how primary sand dunes along the coast will be impacted by water levels during a storm. This includes the combined effect of surge and wave runup. The color band closest to the shoreline is the probability of dune erosion, the middle color band is the probability that sand dunes will be overtopped by waves during the storm, and the outer color band is the probability that the sand dunes will be completely inundated/flooded. The model forecast is available on the Coastal Change Hazards Portal and more information about the model can be found here: Scenario-Based Assessments for Coastal Change Hazard Forecasts.
Pre-and Post-Storm Photo Comparisons
The photo pairs below show aerial photos from September 2015 and similar imagery taken a few days after Hurricane Harvey's landfall. The photos show how the coast was impacted by the storm and are used to validate the forecast model.
Research is part of the National Assessment of Storm-Induced Coastal Change Hazards project.