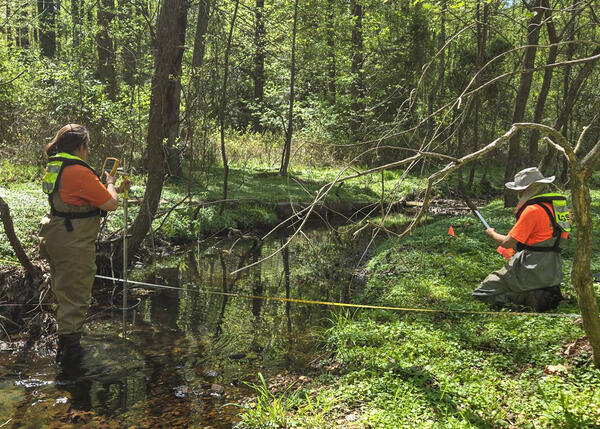
Technicians Laura Yates and Erik Kaseloo complete field activities for a spring habitat assessment at at U.S. Geological Survey streamgage station 0164579245, The Glade, near Pegasus Lane at Reston, VA, on April 24, 2025.
Spring 2025 Photo Contest Winner: Taylor Camper, Honorable Mention category