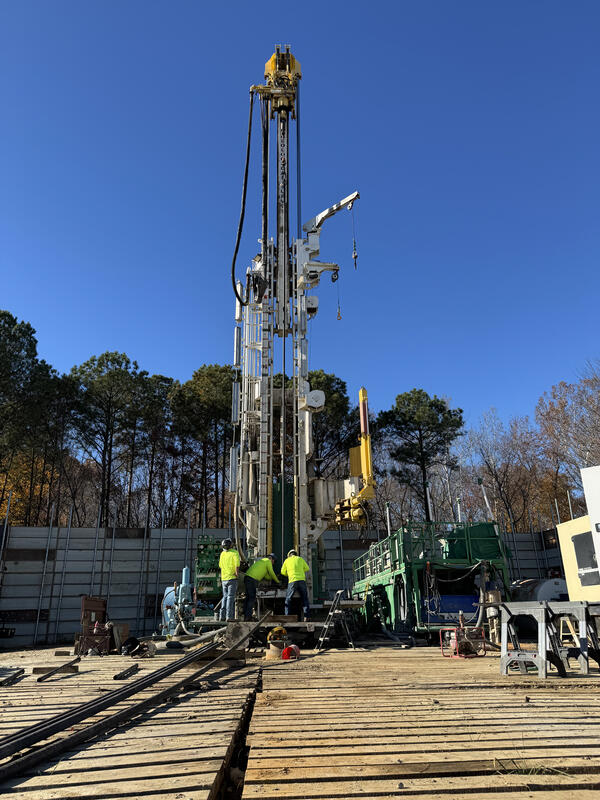
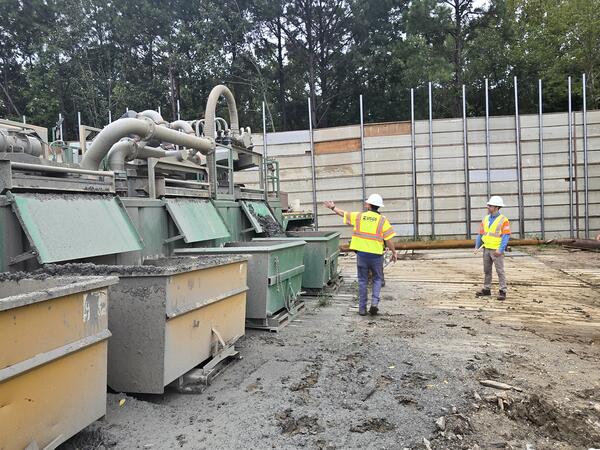
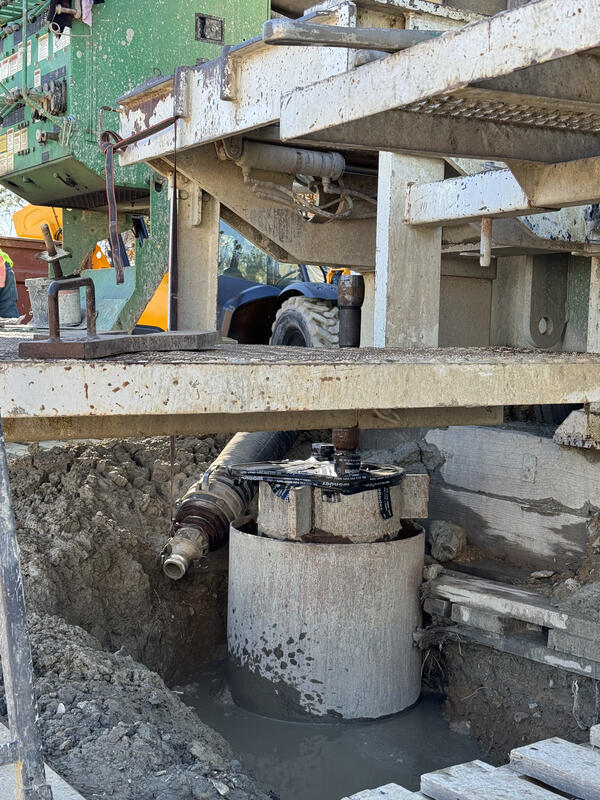
U.S. flag

An official website of the United States government

Images

Explore our planet and learn more about our work through photographs and imagery from scientists and support staff.

Filter Total Items: 327
Map of the Chesapeake Bay Nontidal Network showing Total Phosphorus trends and changes in flow-normalized load, 2014-2023
Chesapeake Bay Nontidal Network: 2014-2023 Total Phosphorus 10-year Trends and Percent Change in Flow-normalized Loads

This map displays the 10-year trend for total phosphorus, as well as the percent total change in flow-normalized loads for total phosphorus across the Chesapeake Bay Watershed from 2014 to 2023. 

This map displays the 10-year trend for total phosphorus, as well as the percent total change in flow-normalized loads for total phosphorus across the Chesapeake Bay Watershed from 2014 to 2023. 

Map of the Chesapeake Bay Nontidal Network showing Orthophosphate trends and changes in flow-normalized load, 2014-2023
Chesapeake Bay Nontidal Network: 2014-2023 Orthophosphate 10-year Trends and Percent Change in Flow-normalized Loads

This map displays the 10-year trend for orthophosphate, as well as the percent total change in flow-normalized loads for orthophosphate across the Chesapeake Bay Watershed from 2014 to 2023. 

This map displays the 10-year trend for orthophosphate, as well as the percent total change in flow-normalized loads for orthophosphate across the Chesapeake Bay Watershed from 2014 to 2023. 

Map of the Chesapeake Bay Nontidal Network showing Nitrate + Nitrite trends and changes in flow-normalized load, 2014-2023
Chesapeake Bay Nontidal Network: 2014-2023 Nitrate + Nitrite 10-year Trends and Percent Change in Flow-normalized Loads

This map displays the 10-year trend for nitrate + nitrate (also known as inorganic nitrogen), as well as the percent total change in flow-normalized loads for nitrate + nitrite across the Chesapeake Bay Watershed from 2014 to 2023. 

This map displays the 10-year trend for nitrate + nitrate (also known as inorganic nitrogen), as well as the percent total change in flow-normalized loads for nitrate + nitrite across the Chesapeake Bay Watershed from 2014 to 2023. 

Map of the Chesapeake Bay Nontidal Network showing Total Nitrogen trends and changes in flow-normalized load, 2014-2023
Chesapeake Bay Nontidal Network: 2014-2023 Total Nitrogen 10-year Trends and Percent Change in Flow-normalized Loads

This map displays the 10-year trend for total nitrogen, as well as the percent total change in flow-normalized loads for total nitrogen across the Chesapeake Bay Watershed from 2014 to 2023. 

This map displays the 10-year trend for total nitrogen, as well as the percent total change in flow-normalized loads for total nitrogen across the Chesapeake Bay Watershed from 2014 to 2023. 

Map of the Chesapeake Bay Nontidal Network showing Orthophosphate Average 5-year yield from 2019-2023
Chesapeake Bay Nontidal Network: 2019-2023 Orthophosphate Average 5-year Per-Acre Load

This map displays the average 5-year per acre loads, also known as yields, of orthophosphate, also known as total inorganic nitrogen, across the Chesapeake Bay Watershed from 2019 to 2023. 

This map displays the average 5-year per acre loads, also known as yields, of orthophosphate, also known as total inorganic nitrogen, across the Chesapeake Bay Watershed from 2019 to 2023. 

Map of the Chesapeake Bay Nontidal Network showing Total Nitrogen Average 5-year yield from 2019-2023
Chesapeake Bay Nontidal Network: 2019-2023 Total Nitrogen Average 5-year Per-Acre Load

This map displays the average 5-year per acre loads, also known as yields, of total nitrogen across the Chesapeake Bay Watershed from 2019 to 2023. 

This map displays the average 5-year per acre loads, also known as yields, of total nitrogen across the Chesapeake Bay Watershed from 2019 to 2023. 

Map of the Chesapeake Bay Nontidal Network showing Total Phosphorus Average 5-year Load from 2019-2023
Chesapeake Bay Nontidal Network: 2019-2023 Total Phosphorus Average 5-year Per-Acre Load
Map of the Chesapeake Bay Nontidal Network showing inorganic N long term trend and change in flow-normalized per acre load
Chesapeake Bay Nontidal Network: 1985-2023 Nitrate + Nitrite Trends and Change in Flow-Normalized Per Acre Load

This map displays the long-term trend for nitrate + nitrite, also known as inorganic nitrogen, as well as the total change in flow-normalized per-acre loads for nitrate + nitrite across the Chesapeake Bay Watershed from 1985 to 2023. 

This map displays the long-term trend for nitrate + nitrite, also known as inorganic nitrogen, as well as the total change in flow-normalized per-acre loads for nitrate + nitrite across the Chesapeake Bay Watershed from 1985 to 2023. 

Map of the Chesapeake Bay Nontidal Network showing Total P long term trend and change in flow-normalized per acre load
Chesapeake Bay Nontidal Network: 1985-2023 Total Phosphorus Trends and Change in Flow-Normalized Per Acre Load

This map displays the long-term trend for total phosphorus, as well as the total change in flow-normalized per-acre loads for total phosphorus across the Chesapeake Bay Watershed from 1985 to 2023. 

This map displays the long-term trend for total phosphorus, as well as the total change in flow-normalized per-acre loads for total phosphorus across the Chesapeake Bay Watershed from 1985 to 2023. 

Chesapeake Bay Nontidal Network: 1985-2023 Orthophosphate Trends and Change in Flow-Normalized Per Acre Load

This map displays the long-term trend for orthophosphate, as well as the total change in flow-normalized per-acre loads for orthophosphate across the Chesapeake Bay Watershed from 1985 to 2023. 

This map displays the long-term trend for orthophosphate, as well as the total change in flow-normalized per-acre loads for orthophosphate across the Chesapeake Bay Watershed from 1985 to 2023. 

Map of the Chesapeake Bay Nontidal Network showing Total Nitrogen long term trend and change in flow-normalized per acre load
Chesapeake Bay Nontidal Network: 1985-2023 Total Nitrogen Trends and Change in Flow-Normalized Per Acre Load

This map displays the long-term trend for total nitrogen, as well as the total change in flow-normalized per-acre loads for total nitrogen across the Chesapeake Bay Watershed from 1985 to 2023. 

This map displays the long-term trend for total nitrogen, as well as the total change in flow-normalized per-acre loads for total nitrogen across the Chesapeake Bay Watershed from 1985 to 2023. 

Map of the Chesapeake Bay Nontidal Network showing sediment long term trend and change in flow-normalized per acre load
Chesapeake Bay Nontidal Network: 1985-2023 Suspended Sediment Trends and Change in Flow-Normalized Per Acre Load

This map displays the long-term trend for suspended sediment, as well as the total change in flow-normalized per-acre loads for suspended sediment across the Chesapeake Bay Watershed from 1985 to 2023. 

This map displays the long-term trend for suspended sediment, as well as the total change in flow-normalized per-acre loads for suspended sediment across the Chesapeake Bay Watershed from 1985 to 2023. 

Map of the Chesapeake Bay Nontidal Network showing inorganic N long term trends and percent change in flow-normalized load
Chesapeake Bay Nontidal Network: 1985-2023 Nitrate + Nitrite Trends and Percent Change in Flow-Normalized Load

This map displays the long-term trend for nitrate + nitrite, also known as inorganic nitrogen, as well as the percent total change in flow-normalized loads for nitrate + nitrite across the Chesapeake Bay Watershed from 1985 to 2023. 

This map displays the long-term trend for nitrate + nitrite, also known as inorganic nitrogen, as well as the percent total change in flow-normalized loads for nitrate + nitrite across the Chesapeake Bay Watershed from 1985 to 2023. 

Map of the Chesapeake Bay Nontidal Network showing Total P long term trends and percent change in flow-normalized load
Chesapeake Bay Nontidal Network: 1985-2023 Total Phosphorus Trends and Percent Change in Flow-Normalized Load

This map displays the long term trend for total phosphorus, as well as the percent total change in flow-normalized loads for total phosphorus across the Chesapeake Bay Watershed from 1985 to 2023. 

This map displays the long term trend for total phosphorus, as well as the percent total change in flow-normalized loads for total phosphorus across the Chesapeake Bay Watershed from 1985 to 2023. 

Map of the Chesapeake Bay Nontidal Network showing orthophosphate long term trends and percent change in flow-normalized load
Chesapeake Bay Nontidal Network: 1985-2023 Orthophosphate Trends and Percent Change in Flow-Normalized Load

This map displays the long term trend for orthophosphate, as well as the percent total change in flow-normalized loads for orthophosphate across the Chesapeake Bay Watershed from 1985 to 2023. 

This map displays the long term trend for orthophosphate, as well as the percent total change in flow-normalized loads for orthophosphate across the Chesapeake Bay Watershed from 1985 to 2023. 

Map of the Chesapeake Bay Nontidal Network showing Total Nitrogen long term trends and percent change in flow-normalized load
Chesapeake Bay Nontidal Network: 1985-2023 Total Nitrogen Trends and Percent Change in Flow-Normalized Load

This map displays the long term trend for total nitrogen, as well as the percent total change in flow-normalized loads for total nitrogen across the Chesapeake Bay Watershed from 1985 to 2023. 

This map displays the long term trend for total nitrogen, as well as the percent total change in flow-normalized loads for total nitrogen across the Chesapeake Bay Watershed from 1985 to 2023. 

Map of the Chesapeake Bay Nontidal Network showing suspended sediment long term trends and %change in flow-normalized load
Chesapeake Bay Nontidal Network: 1985-2023 Suspended Sediment Trends and Percent Change in Flow-Normalized Load

This map displays the long term trend for suspended sediment, as well as the percent total change in flow-normalized loads for suspended sediment across the Chesapeake Bay Watershed from 1985 to 2023. 

This map displays the long term trend for suspended sediment, as well as the percent total change in flow-normalized loads for suspended sediment across the Chesapeake Bay Watershed from 1985 to 2023. 

Map of the Chesapeake Bay Nontidal Network showing Total Nitrogen trends and changes in flow-normalized yield, 2014-2023
Chesapeake Bay Nontidal Network: 2014-2023 Total Nitrogen 10-year Trends and Change in Flow-normalized Per Acre Loads

This map displays the 10-year trend for total nitrogen, as well as the total change in flow-normalized loads per acre for total nitrogen across the Chesapeake Bay Watershed from 2014 to 2023. 

This map displays the 10-year trend for total nitrogen, as well as the total change in flow-normalized loads per acre for total nitrogen across the Chesapeake Bay Watershed from 2014 to 2023. 

Was this page helpful?