Deer Rapids, North Fork Shenandoah River, Virginia.
Data for this monitoring site can be found at USGS Water Data for the Nation.

Official websites use .gov
A .gov website belongs to an official government organization in the United States.
Secure .gov websites use HTTPS
A lock () or https:// means you’ve safely connected to the .gov website. Share sensitive information only on official, secure websites.
Explore our planet and learn more about our work through photographs and imagery from scientists and support staff.

Deer Rapids, North Fork Shenandoah River, Virginia.
Data for this monitoring site can be found at USGS Water Data for the Nation.
Deer Rapids, North Fork Shenandoah River, Virginia.
Data for this monitoring site can be found at USGS Water Data for the Nation.

Brendan Foster, a USGS scientist, collects a water quality sample from a Lake Anna dock.
USGS scientists are exploring factors driving Harmful Algal Blooms. Learn more here.
Brendan Foster, a USGS scientist, collects a water quality sample from a Lake Anna dock.
USGS scientists are exploring factors driving Harmful Algal Blooms. Learn more here.

Lake Anna is a lake in Virginia impacted by Harmful Algal Blooms, or HABs. Note the greenish color of the water. This is caused by an excess of algae, some species of which could be toxic.
Lake Anna is a lake in Virginia impacted by Harmful Algal Blooms, or HABs. Note the greenish color of the water. This is caused by an excess of algae, some species of which could be toxic.
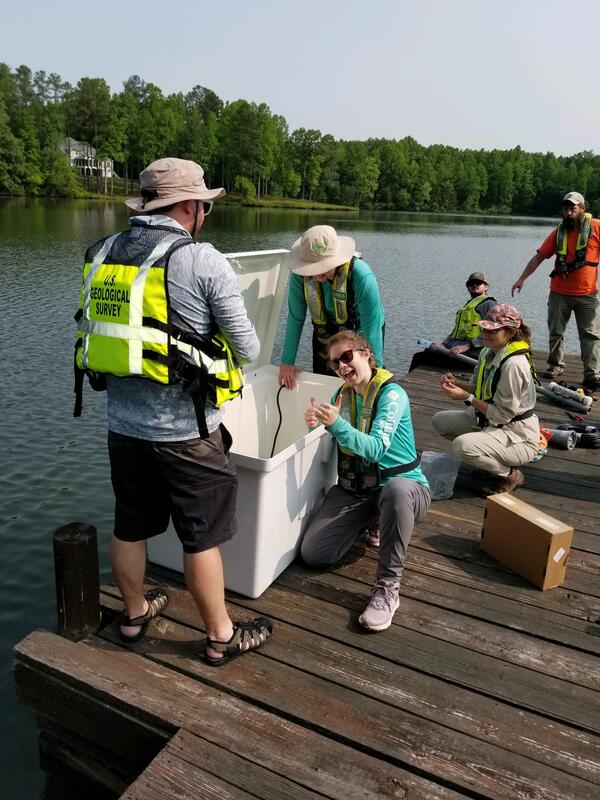
Scientists from the Virginia and West Virginia Water Science Center setting up a water quality monitoring station on Lake Anna
Scientists from the Virginia and West Virginia Water Science Center setting up a water quality monitoring station on Lake Anna

A cableway training session conducted during the Virginia and West Virginia Water Science Center's annual data summit in Lexington, Virginia. Photo is taken at a streamgage at Maury River near Buena Vista, Virginia.
Spring 2023 Photo Contest Winner: Carson Wright, People category
A cableway training session conducted during the Virginia and West Virginia Water Science Center's annual data summit in Lexington, Virginia. Photo is taken at a streamgage at Maury River near Buena Vista, Virginia.
Spring 2023 Photo Contest Winner: Carson Wright, People category

Turbidity is a measure of water clarity. High amounts of suspended solids increase turbidity. The more turbid the water, the less light can penetrate. In turbid waters, aquatic plants may die due to decreased light availability.
Turbidity is a measure of water clarity. High amounts of suspended solids increase turbidity. The more turbid the water, the less light can penetrate. In turbid waters, aquatic plants may die due to decreased light availability.

A stream's flashiness is determined by how quickly water levels peak after a rain event, and how quickly water levels fall after the peak. The figure above shows and urban canal (left) that is very flashy, compared to a less flashy natural stream (right).
A stream's flashiness is determined by how quickly water levels peak after a rain event, and how quickly water levels fall after the peak. The figure above shows and urban canal (left) that is very flashy, compared to a less flashy natural stream (right).

When precipitation falls over urban watersheds, its fate may differ from precipitation that falls over undeveloped, rural or natural watersheds. Different urban land use types can affect strormwater runoff patterns in different ways. There are many potential non-point sources of nutrients, sediment, and other contaminants within urban watersheds.
When precipitation falls over urban watersheds, its fate may differ from precipitation that falls over undeveloped, rural or natural watersheds. Different urban land use types can affect strormwater runoff patterns in different ways. There are many potential non-point sources of nutrients, sediment, and other contaminants within urban watersheds.

Drilling a new borehole extensometer is a delicate task.
Drilling a new borehole extensometer is a delicate task.

In order to construct the borehole extensometer at West Point, 1420 feet of 7 inch steel casing was fed into the ground using the drilling rig, as pictured here. This steel casing allows the borehole to hold its shape and not collapse in on itself, and isolates the 2 inch thick extensometer rod from the surrounding sediments.
In order to construct the borehole extensometer at West Point, 1420 feet of 7 inch steel casing was fed into the ground using the drilling rig, as pictured here. This steel casing allows the borehole to hold its shape and not collapse in on itself, and isolates the 2 inch thick extensometer rod from the surrounding sediments.

While drilling the 1420-foot-deep borehole for the West Point Extensometer, USGS geologists take the opportunity to learn all they can about the underlying geology. As they drill deeper, sediments are pumped out of the borehole. Geologists take samples of the sediments every 20 feet and note their composition.
While drilling the 1420-foot-deep borehole for the West Point Extensometer, USGS geologists take the opportunity to learn all they can about the underlying geology. As they drill deeper, sediments are pumped out of the borehole. Geologists take samples of the sediments every 20 feet and note their composition.

Nutrient pollution is caused when excess nutrients in the form of nitrogen and phosphorus are introduced into aquatic ecosystems, often due to leaching or surface water runoff. These excess nutrients can contribute to the degradation of downstream ecosystems.
Nutrient pollution is caused when excess nutrients in the form of nitrogen and phosphorus are introduced into aquatic ecosystems, often due to leaching or surface water runoff. These excess nutrients can contribute to the degradation of downstream ecosystems.

When rainwater falls over a watershed, its fate is determined by multiple factors, such as the relief of the watershed, the permeability of the surface it falls on, the presence and density of plant life, and the drainage density of the watershed.
When rainwater falls over a watershed, its fate is determined by multiple factors, such as the relief of the watershed, the permeability of the surface it falls on, the presence and density of plant life, and the drainage density of the watershed.

Abstract:

Photograph of the USGS precipitation gage located at Fairfax Middle School in Fairfax County. Data for this station can be found on USGS Water Data For the Nation.
Photograph of the USGS precipitation gage located at Fairfax Middle School in Fairfax County. Data for this station can be found on USGS Water Data For the Nation.

Photograph of the USGS precipitation gage located at Churchill Road Park in Fairfax County. Data for this station can be found on USGS Water Data For the Nation.
Photograph of the USGS precipitation gage located at Churchill Road Park in Fairfax County. Data for this station can be found on USGS Water Data For the Nation.

A USGS crest stage gage used for measuring peak flow. Part of the Fairfax County Water Resources Monitoring Network.
A USGS crest stage gage used for measuring peak flow. Part of the Fairfax County Water Resources Monitoring Network.
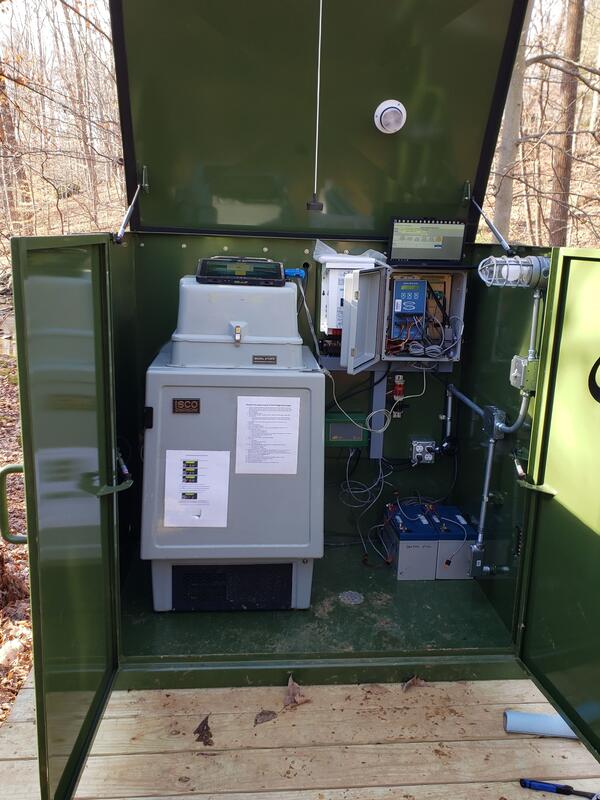
The water quality monitoring station at Dead Run. The gage house contains water quality monitoring equipment inside. Part of the Fairfax Water Resources Monitoring Network.
The water quality monitoring station at Dead Run. The gage house contains water quality monitoring equipment inside. Part of the Fairfax Water Resources Monitoring Network.
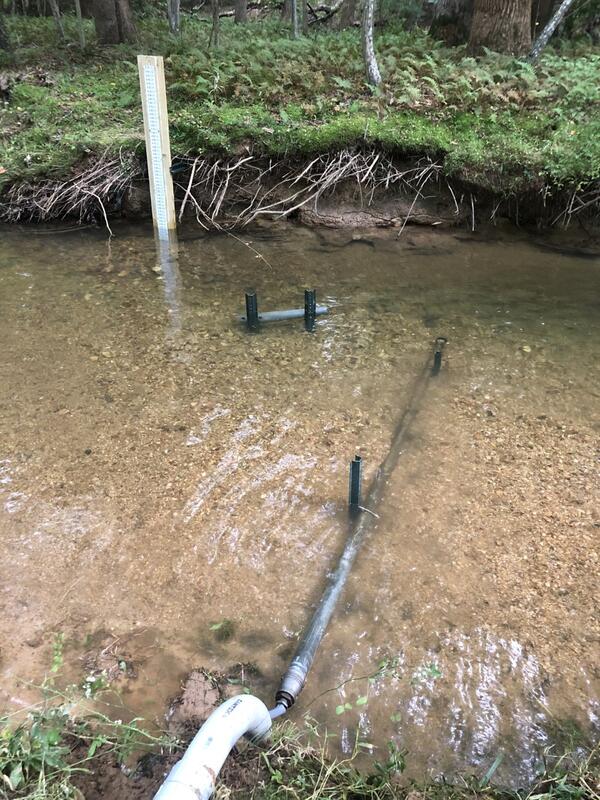
This photo shows various water-quality monitoring equipment installed in a stream.
The staff plate (top left) is a physical ruler installed in the stream that is used to check the accuracy of other methods of measuring stream stage. This staff plate is easy to read and compare to other measurements when scientists visit the site.

USGS researcher Aaron Porter at the Storm Drain at Rivers Ridge Circle near Newport News, VA monitoring site. Part of the Hampton Roads Regional Water Quality Monitoring Program
USGS researcher Aaron Porter at the Storm Drain at Rivers Ridge Circle near Newport News, VA monitoring site. Part of the Hampton Roads Regional Water Quality Monitoring Program

USGS researchers Aaron Porter and Chelsea Vande Pol use a handheld acoustic doppler velocimeter to measure streamflow in a stormwater drain as a part of the Hampton Roads Regional Water Quality Monitoring Program.
USGS researchers Aaron Porter and Chelsea Vande Pol use a handheld acoustic doppler velocimeter to measure streamflow in a stormwater drain as a part of the Hampton Roads Regional Water Quality Monitoring Program.