
This image shows the spectral bandpasses for the sensors on all Landsat satellites.
What are the best Landsat spectral bands for use in my research?
The Spectral Characteristics Viewer is an interactive tool that can be used to visualize how the bands, or channels, of different satellite sensors measure the intensity of the many wavelengths (colors) of light. This is also known as the relative spectral response (RSR). By overlaying the spectral curves from different features (spectra), one can determine which bands of the selected sensor will work for the application.
Learn more: Common Landsat Band Combinations
| Band | Wavelength | Useful for mapping |
|---|---|---|
| Band 1 - coastal aerosol | 0.43-0.45 | Coastal and aerosol studies |
| Band 2 - blue | 0.45-0.51 | Bathymetric mapping, distinguishing soil from vegetation and deciduous from coniferous vegetation |
| Band 3 - green | 0.53-0.59 | Emphasizes peak vegetation, which is useful for assessing plant vigor |
| Band 4 - red | 0.64-0.67 | Discriminates vegetation slopes |
| Band 5 - Near Infrared (NIR) | 0.85-0.88 | Emphasizes biomass content and shorelines |
| Band 6 - Short-wave Infrared (SWIR) 1 | 1.57-1.65 | Discriminates moisture content of soil and vegetation; penetrates thin clouds |
| Band 7 - Short-wave Infrared (SWIR) 2 | 2.11-2.29 | Improved moisture content of soil and vegetation; penetrates thin clouds |
| Band 8 - Panchromatic | 0.50-0.68 | 15 meter resolution, sharper image definition |
| Band 9 - Cirrus | 1.36-1.38 | Improved detection of cirrus cloud contamination |
| Band 10 - TIRS 1 | 10.60-11.19 | 100 meter resolution, thermal mapping and estimated soil moisture |
| Band 11 - TIRS 2 | 11.50-12.51 | 100 meter resolution, improved thermal mapping and estimated soil moisture |
| Band | Wavelength | Useful for mapping |
|---|---|---|
| Band 1 - blue | 0.45-0.52 | Bathymetric mapping, distinguishing soil from vegetation and deciduous from coniferous vegetation |
| Band 2 - green | 0.52-0.60 | Emphasizes peak vegetation, which is useful for assessing plant vigor |
| Band 3 - red | 0.63-0.69 | Discriminates vegetation slopes |
| Band 4 - Near Infrared | 0.77-0.90 | Emphasizes biomass content and shorelines |
| Band 5 - Short-wave Infrared | 1.55-1.75 | Discriminates moisture content of soil and vegetation; penetrates thin clouds |
| Band 6 - Thermal Infrared | 10.40-12.50 | Thermal mapping and estimated soil moisture |
| Band 7 - Short-wave Infrared | 2.09-2.35 | Hydrothermally altered rocks associated with mineral deposits |
| Band 8 - Panchromatic (Landsat 7 only) | 0.52-0.90 | 15 meter resolution, sharper image definition |
| Landsat MSS 1, 2, 3 Spectral Bands | Landsat MSS 4, 5 Spectral Bands | Wavelength | Useful for mapping |
|---|---|---|---|
| Band 4 - green | Band 1 - green | 0.5-0.6 | Sediment-laden water, delineates areas of shallow water |
| Band 5 - red | Band 2 - red | 0.6-0.7 | Cultural features |
| Band 6 - Near Infrared | Band 3 - Near Infrared | 0.7-0.8 | Vegetation boundary between land and water, and landforms |
| Band 7 - Near Infrared | Band 4 - Near Infrared | 0.8-1.1 | Penetrates atmospheric haze best, emphasizes vegetation, boundary between land and water, and landforms |
Related

What are the band designations for the Landsat satellites? What are the band designations for the Landsat satellites?
The sensors onboard each of the Landsat satellites were designed to acquire data in different wavelengths within the electromagnetic spectrum. View Bandpass Wavelengths for all Landsat Sensors The Multispectral Scanner (MSS) carried on Landsat 1,2,3,4 and 5 collected data in four ranges (bands); the Thematic Mapper (TM) sensor on Landsat 4 and Landsat 5 included those bands found on earlier...

What are some known issues that users might find in Landsat data? What are some known issues that users might find in Landsat data?
A number of artifacts and anomalies can happen to any remote sensing data. Banding, dropped scan lines, and detector failures are only a few of the anomalies that can be seen in Landsat data. Go to Landsat Known Issues for details about anomalies that have been discovered and investigated.

How do I open Landsat satellite data files? How do I open Landsat satellite data files?
Many image processing programs can handle GeoTIFF and Cloud optimized GeoTIFF (COG) Landsat files, including free software like Multispec and QGIS. To view Landsat scenes without using specialized software, download Landsat Full Resolution browse images (.jpg) from EarthExplorer or GloVis. * The USGS does NOT endorse or support specific software packages. Any usability questions relating to...

Can Landsat satellite acquisition requests be made for a specific date and location? Can Landsat satellite acquisition requests be made for a specific date and location?
The Landsat 8 and Landsat 9 satellites together acquire approximately 1,500 scenes daily. These scenes are available for download within 6 hours of acquisition. Landsat satellite acquisitions are managed as a system, known as a satellite constellation. Long-Term Acquisition Plans (LTAPs) direct and optimize the daily acquisitions of each active Landsat satellite. Special requests for future...

What are the acquisition schedules for the Landsat satellites? What are the acquisition schedules for the Landsat satellites?
Landsat 8 and Landsat 9 orbit Earth at an altitude of 705 kilometers, or 438 miles. Each satellite captures images across a 185-kilometer, or 115-mile, swath. The satellites move from north to south over the sunlight side of Earth in a sun-synchronous orbit. Each satellite circles Earth every 99 minutes and completes about 14 orbits a day – and passes over the same location once every 16 days...

How do I search for and download Landsat data? How do I search for and download Landsat data?
Landsat data products held in the USGS archives can be searched and downloaded at no charge from a variety of sources. Visit Landsat Data Access for information about how Landsat data products can be downloaded individually or in bulk. Landsat imagery not found in the USGS archive might have been collected by one of the USGS International Cooperator ground stations, each of which are the primary...

What is the Landsat satellite program and why is it important? What is the Landsat satellite program and why is it important?
The Landsat Program is a series of Earth-observing satellite missions jointly managed by NASA and the U.S. Geological Survey. On July 23, 1972, in cooperation with NASA, the Earth Resources Technology Satellite (ERTS-1) was launched. It was later renamed Landsat 1. Additional Landsat satellites have launched to bring the world an archive of remote sensing data. Currently orbiting and active...

What are Landsat Collections? What are Landsat Collections?
In 2016, the USGS reorganized the Landsat archive into a tiered collection. This structure ensures that Landsat Level-1 products provide a consistent archive of known data quality to support time-series analyses and data “stacking”, while controlling continuous improvement of the archive and access to all data as they are acquired. Learn more: Landsat Collections Landsat Data Access

What are Landsat Collection Tiers? What are Landsat Collection Tiers?
Landsat Collection Tiers are the inventory structure for Level-1 data products and are based on data quality and level of processing. The tier definition purpose is to support easier identification of suitable scenes for time-series pixel-level analysis, and provide temporary data that are processed immediately upon downlink to be dispensed quickly in emergency response situations with limited...
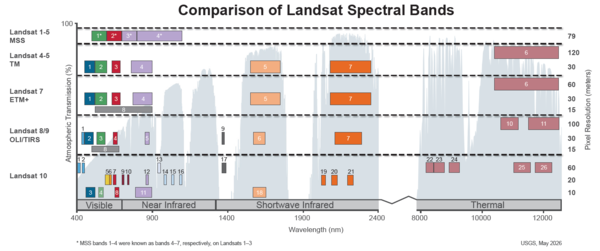
Spectral Bandpasses for all Landsat Sensors
This image shows the spectral bandpasses for the sensors on all Landsat satellites.

Common Landsat Band Combinations
This graphic displays a few of the common band Red-Green-Blue (RGB) combinations of Landsat data. For more information about using Landsat bands in your research, visit the following pages:
This graphic displays a few of the common band Red-Green-Blue (RGB) combinations of Landsat data. For more information about using Landsat bands in your research, visit the following pages:

Landsat in Action - Land Cover and Land Cover Change with Tom Loveland
Landsat in Action - Land Cover and Land Cover Change with Tom LovelandTom Loveland talks about using Landsat's data for land use and land cover change research.
Find this video and thousands more at https://usgs.gov/gallery.
Landsat in Action - Land Cover and Land Cover Change with Tom Loveland
Landsat in Action - Land Cover and Land Cover Change with Tom LovelandTom Loveland talks about using Landsat's data for land use and land cover change research.
Find this video and thousands more at https://usgs.gov/gallery.

Landsat in Action - The Importance of Landsat with Curtis Woodcock
Landsat in Action - The Importance of Landsat with Curtis WoodcockBoston University Professor Curtis Woodcock talks about the significance Landsat was had in science and what he hopes to see as the mission continues.
Landsat in Action - The Importance of Landsat with Curtis Woodcock
Landsat in Action - The Importance of Landsat with Curtis WoodcockBoston University Professor Curtis Woodcock talks about the significance Landsat was had in science and what he hopes to see as the mission continues.

Landsat in Action - Tracking Water Changes with John Schott
Landsat in Action - Tracking Water Changes with John SchottJohn Schott with the Rochester Institute of Technology discusses using Landsat Data over the years, and how its Thermal data tracks temperature changes in water bodies.
Landsat in Action - Tracking Water Changes with John Schott
Landsat in Action - Tracking Water Changes with John SchottJohn Schott with the Rochester Institute of Technology discusses using Landsat Data over the years, and how its Thermal data tracks temperature changes in water bodies.

Landsat Collections
Landsat Collections: Providing a Stable Environmental Record for Time Series Analysis
Landsat Collections: Providing a Stable Environmental Record for Time Series Analysis

Landsat In Action - Assessing Global Impact with Alan Belward
Landsat In Action - Assessing Global Impact with Alan BelwardAlan Belward from the European Union's Joint Research Center discusses how Landsat helps his team promote sustainable development.
Landsat In Action - Assessing Global Impact with Alan Belward
Landsat In Action - Assessing Global Impact with Alan BelwardAlan Belward from the European Union's Joint Research Center discusses how Landsat helps his team promote sustainable development.

Landsat Collections — What are Tiers?
This is the third video in a series describing the new U.S. Geological Survey (USGS) Landsat Collection 1 inventory structure. Collection 1 required the reprocessing of all archived Landsat data to achieve radiometric and geometric consistency of Level-1 products through time and across all Landsat sensors.
This is the third video in a series describing the new U.S. Geological Survey (USGS) Landsat Collection 1 inventory structure. Collection 1 required the reprocessing of all archived Landsat data to achieve radiometric and geometric consistency of Level-1 products through time and across all Landsat sensors.

Landsat Collections - RMSE
Landsat Collections: Providing a Stable Environment Record for Time Series Analysis
Landsat Collections: Providing a Stable Environment Record for Time Series Analysis
Related
What are the band designations for the Landsat satellites? What are the band designations for the Landsat satellites?
The sensors onboard each of the Landsat satellites were designed to acquire data in different wavelengths within the electromagnetic spectrum. View Bandpass Wavelengths for all Landsat Sensors The Multispectral Scanner (MSS) carried on Landsat 1,2,3,4 and 5 collected data in four ranges (bands); the Thematic Mapper (TM) sensor on Landsat 4 and Landsat 5 included those bands found on earlier...
What are some known issues that users might find in Landsat data? What are some known issues that users might find in Landsat data?
A number of artifacts and anomalies can happen to any remote sensing data. Banding, dropped scan lines, and detector failures are only a few of the anomalies that can be seen in Landsat data. Go to Landsat Known Issues for details about anomalies that have been discovered and investigated.
How do I open Landsat satellite data files? How do I open Landsat satellite data files?
Many image processing programs can handle GeoTIFF and Cloud optimized GeoTIFF (COG) Landsat files, including free software like Multispec and QGIS. To view Landsat scenes without using specialized software, download Landsat Full Resolution browse images (.jpg) from EarthExplorer or GloVis. * The USGS does NOT endorse or support specific software packages. Any usability questions relating to...
Can Landsat satellite acquisition requests be made for a specific date and location? Can Landsat satellite acquisition requests be made for a specific date and location?
The Landsat 8 and Landsat 9 satellites together acquire approximately 1,500 scenes daily. These scenes are available for download within 6 hours of acquisition. Landsat satellite acquisitions are managed as a system, known as a satellite constellation. Long-Term Acquisition Plans (LTAPs) direct and optimize the daily acquisitions of each active Landsat satellite. Special requests for future...
What are the acquisition schedules for the Landsat satellites? What are the acquisition schedules for the Landsat satellites?
Landsat 8 and Landsat 9 orbit Earth at an altitude of 705 kilometers, or 438 miles. Each satellite captures images across a 185-kilometer, or 115-mile, swath. The satellites move from north to south over the sunlight side of Earth in a sun-synchronous orbit. Each satellite circles Earth every 99 minutes and completes about 14 orbits a day – and passes over the same location once every 16 days...
How do I search for and download Landsat data? How do I search for and download Landsat data?
Landsat data products held in the USGS archives can be searched and downloaded at no charge from a variety of sources. Visit Landsat Data Access for information about how Landsat data products can be downloaded individually or in bulk. Landsat imagery not found in the USGS archive might have been collected by one of the USGS International Cooperator ground stations, each of which are the primary...
What is the Landsat satellite program and why is it important? What is the Landsat satellite program and why is it important?
The Landsat Program is a series of Earth-observing satellite missions jointly managed by NASA and the U.S. Geological Survey. On July 23, 1972, in cooperation with NASA, the Earth Resources Technology Satellite (ERTS-1) was launched. It was later renamed Landsat 1. Additional Landsat satellites have launched to bring the world an archive of remote sensing data. Currently orbiting and active...
What are Landsat Collections? What are Landsat Collections?
In 2016, the USGS reorganized the Landsat archive into a tiered collection. This structure ensures that Landsat Level-1 products provide a consistent archive of known data quality to support time-series analyses and data “stacking”, while controlling continuous improvement of the archive and access to all data as they are acquired. Learn more: Landsat Collections Landsat Data Access
What are Landsat Collection Tiers? What are Landsat Collection Tiers?
Landsat Collection Tiers are the inventory structure for Level-1 data products and are based on data quality and level of processing. The tier definition purpose is to support easier identification of suitable scenes for time-series pixel-level analysis, and provide temporary data that are processed immediately upon downlink to be dispensed quickly in emergency response situations with limited...
Spectral Bandpasses for all Landsat Sensors
This image shows the spectral bandpasses for the sensors on all Landsat satellites.
This image shows the spectral bandpasses for the sensors on all Landsat satellites.
Common Landsat Band Combinations
This graphic displays a few of the common band Red-Green-Blue (RGB) combinations of Landsat data. For more information about using Landsat bands in your research, visit the following pages:
This graphic displays a few of the common band Red-Green-Blue (RGB) combinations of Landsat data. For more information about using Landsat bands in your research, visit the following pages:
Landsat in Action - Land Cover and Land Cover Change with Tom Loveland
Landsat in Action - Land Cover and Land Cover Change with Tom LovelandTom Loveland talks about using Landsat's data for land use and land cover change research.
Find this video and thousands more at https://usgs.gov/gallery.
Landsat in Action - Land Cover and Land Cover Change with Tom Loveland
Landsat in Action - Land Cover and Land Cover Change with Tom LovelandTom Loveland talks about using Landsat's data for land use and land cover change research.
Find this video and thousands more at https://usgs.gov/gallery.
Landsat in Action - The Importance of Landsat with Curtis Woodcock
Landsat in Action - The Importance of Landsat with Curtis WoodcockBoston University Professor Curtis Woodcock talks about the significance Landsat was had in science and what he hopes to see as the mission continues.
Landsat in Action - The Importance of Landsat with Curtis Woodcock
Landsat in Action - The Importance of Landsat with Curtis WoodcockBoston University Professor Curtis Woodcock talks about the significance Landsat was had in science and what he hopes to see as the mission continues.
Landsat in Action - Tracking Water Changes with John Schott
Landsat in Action - Tracking Water Changes with John SchottJohn Schott with the Rochester Institute of Technology discusses using Landsat Data over the years, and how its Thermal data tracks temperature changes in water bodies.
Landsat in Action - Tracking Water Changes with John Schott
Landsat in Action - Tracking Water Changes with John SchottJohn Schott with the Rochester Institute of Technology discusses using Landsat Data over the years, and how its Thermal data tracks temperature changes in water bodies.
Landsat Collections
Landsat Collections: Providing a Stable Environmental Record for Time Series Analysis
Landsat Collections: Providing a Stable Environmental Record for Time Series Analysis
Landsat In Action - Assessing Global Impact with Alan Belward
Landsat In Action - Assessing Global Impact with Alan BelwardAlan Belward from the European Union's Joint Research Center discusses how Landsat helps his team promote sustainable development.
Landsat In Action - Assessing Global Impact with Alan Belward
Landsat In Action - Assessing Global Impact with Alan BelwardAlan Belward from the European Union's Joint Research Center discusses how Landsat helps his team promote sustainable development.
Landsat Collections — What are Tiers?
This is the third video in a series describing the new U.S. Geological Survey (USGS) Landsat Collection 1 inventory structure. Collection 1 required the reprocessing of all archived Landsat data to achieve radiometric and geometric consistency of Level-1 products through time and across all Landsat sensors.
This is the third video in a series describing the new U.S. Geological Survey (USGS) Landsat Collection 1 inventory structure. Collection 1 required the reprocessing of all archived Landsat data to achieve radiometric and geometric consistency of Level-1 products through time and across all Landsat sensors.
Landsat Collections - RMSE
Landsat Collections: Providing a Stable Environment Record for Time Series Analysis
Landsat Collections: Providing a Stable Environment Record for Time Series Analysis
Updated Date: May 21, 2025