Topobathymetric digital elevation model of the Kootenai River, Idaho.
Topobathymetric digital elevation model of the Kootenai River, Idaho.Topobathymetric digital elevation model of the Kootenai River, Idaho. Image was created by Cindy Thatcher.

Official websites use .gov
A .gov website belongs to an official government organization in the United States.
Secure .gov websites use HTTPS
A lock () or https:// means you’ve safely connected to the .gov website. Share sensitive information only on official, secure websites.
A Geographic Information System (GIS) is a computer system that analyzes and displays geographically referenced information. It uses data that is attached to a unique location.
Most of the information we have about our world contains a location reference: Where are USGS streamgages located? Where was a rock sample collected? Exactly where are all of a city's fire hydrants?
If, for example, a rare plant is observed in three different places, GIS analysis might show that the plants are all on north-facing slopes that are above an elevation of 1,000 feet and that get more than ten inches of rain per year. GIS maps can then display all locations in the area that have similar conditions, so researchers know where to look for more of the rare plants.
By knowing the geographic location of farms using a specific fertilizer, GIS analysis of farm locations, stream locations, elevations, and rainfall will show which streams are likely to carry that fertilizer downstream.
These are just a few examples of the many uses of GIS in earth sciences, biology, resource management, and many other fields.


Modern USGS topographic maps are derived from GIS data sets and are distributed as a digital Portable Document Format (PDF) for the benefit of non-specialist users. USGS topographic maps are considered the output of, rather than the input to, GIS. Many Geographic Information System (GIS) software cannot read or import a PDF file. It is not recommended to use USGS topographic maps in a GIS...

GeoPDF files for both Historical Topographic maps (produced 1884-2006), US Topo maps (produced 2009-present), and OnDemand Topo maps come with an XML metadata file attached to each GeoPDF file. To access the metadata file, download the GeoPDF file, open it in Acrobat Reader, click on the paperclip icon, then select a file from the list that appears (US Topo maps also come with a Map Symbols sheet...

The method used to portray a part of the spherical Earth on a flat surface, whether a paper map or a computer screen, is called a map projection. No flat map can rival a globe in truly representing the surface of the entire Earth, so every flat map misrepresents the surface of the Earth in some way. A flat map can show one or more--but never all--of the following: True directions True distances...

Topobathymetric digital elevation model of the Kootenai River, Idaho. Image was created by Cindy Thatcher.
Topobathymetric digital elevation model of the Kootenai River, Idaho. Image was created by Cindy Thatcher.

In this lesson we will provide a brief introduction on how to use The National Map Download Application to download USGS maps and data. The TNM Download Application allows users to explore and access the USGS staged products available for download.
In this lesson we will provide a brief introduction on how to use The National Map Download Application to download USGS maps and data. The TNM Download Application allows users to explore and access the USGS staged products available for download.
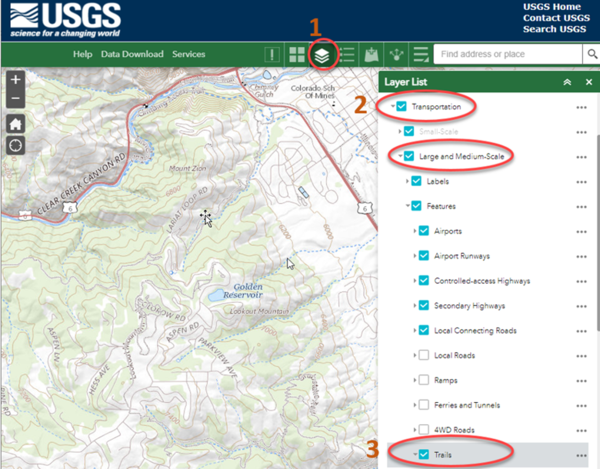
The image shows the National Map Viewer website with trails layer turned on under the Transportation group of layers.
The image shows the National Map Viewer website with trails layer turned on under the Transportation group of layers.

In this lesson, we will discuss each of the eight base layers of The National Map (TNM). Understanding the content of each layer, where the data comes from, and how this information is managed, is an important step in better utilizing The National Map and its products and services.
Timestamps:
In this lesson, we will discuss each of the eight base layers of The National Map (TNM). Understanding the content of each layer, where the data comes from, and how this information is managed, is an important step in better utilizing The National Map and its products and services.
Timestamps:

By processing lidar point clouds (left) to bare earth DEMs (right), the vegetation is stripped away to reveal past landslides and steep slopes at risk of failure masked by forested canopies. In dense forests, landslides--especially old landslides--might be invisible on aerial images and hard to detect from the ground.
By processing lidar point clouds (left) to bare earth DEMs (right), the vegetation is stripped away to reveal past landslides and steep slopes at risk of failure masked by forested canopies. In dense forests, landslides--especially old landslides--might be invisible on aerial images and hard to detect from the ground.

A Digital Elevation Model (DEM) of a section of Bitterroot National Forest.
A Digital Elevation Model (DEM) of a section of Bitterroot National Forest.

The Revolution in Mapping at the U.S. Geological Survey
by Susan P. Benjamin, Research Geographer
The Revolution in Mapping at the U.S. Geological Survey
by Susan P. Benjamin, Research Geographer
Modern USGS topographic maps are derived from GIS data sets and are distributed as a digital Portable Document Format (PDF) for the benefit of non-specialist users. USGS topographic maps are considered the output of, rather than the input to, GIS. Many Geographic Information System (GIS) software cannot read or import a PDF file. It is not recommended to use USGS topographic maps in a GIS...
GeoPDF files for both Historical Topographic maps (produced 1884-2006), US Topo maps (produced 2009-present), and OnDemand Topo maps come with an XML metadata file attached to each GeoPDF file. To access the metadata file, download the GeoPDF file, open it in Acrobat Reader, click on the paperclip icon, then select a file from the list that appears (US Topo maps also come with a Map Symbols sheet...
The method used to portray a part of the spherical Earth on a flat surface, whether a paper map or a computer screen, is called a map projection. No flat map can rival a globe in truly representing the surface of the entire Earth, so every flat map misrepresents the surface of the Earth in some way. A flat map can show one or more--but never all--of the following: True directions True distances...
Topobathymetric digital elevation model of the Kootenai River, Idaho. Image was created by Cindy Thatcher.
Topobathymetric digital elevation model of the Kootenai River, Idaho. Image was created by Cindy Thatcher.
In this lesson we will provide a brief introduction on how to use The National Map Download Application to download USGS maps and data. The TNM Download Application allows users to explore and access the USGS staged products available for download.
In this lesson we will provide a brief introduction on how to use The National Map Download Application to download USGS maps and data. The TNM Download Application allows users to explore and access the USGS staged products available for download.
The image shows the National Map Viewer website with trails layer turned on under the Transportation group of layers.
The image shows the National Map Viewer website with trails layer turned on under the Transportation group of layers.
In this lesson, we will discuss each of the eight base layers of The National Map (TNM). Understanding the content of each layer, where the data comes from, and how this information is managed, is an important step in better utilizing The National Map and its products and services.
Timestamps:
In this lesson, we will discuss each of the eight base layers of The National Map (TNM). Understanding the content of each layer, where the data comes from, and how this information is managed, is an important step in better utilizing The National Map and its products and services.
Timestamps:
By processing lidar point clouds (left) to bare earth DEMs (right), the vegetation is stripped away to reveal past landslides and steep slopes at risk of failure masked by forested canopies. In dense forests, landslides--especially old landslides--might be invisible on aerial images and hard to detect from the ground.
By processing lidar point clouds (left) to bare earth DEMs (right), the vegetation is stripped away to reveal past landslides and steep slopes at risk of failure masked by forested canopies. In dense forests, landslides--especially old landslides--might be invisible on aerial images and hard to detect from the ground.
A Digital Elevation Model (DEM) of a section of Bitterroot National Forest.
A Digital Elevation Model (DEM) of a section of Bitterroot National Forest.
The Revolution in Mapping at the U.S. Geological Survey
by Susan P. Benjamin, Research Geographer
The Revolution in Mapping at the U.S. Geological Survey
by Susan P. Benjamin, Research Geographer