
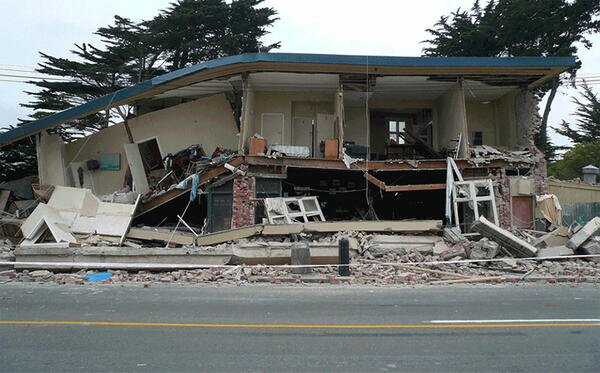
Building damanged by the February 2011 earthquake in Christchurch, New Zealand.
What is the probability that an earthquake is a foreshock to a larger earthquake?
Around the world, the likelihood that an earthquake will be followed by a larger earthquake nearby and within a week is about 5%.
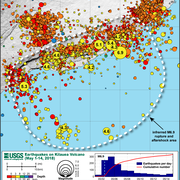
When an earthquake occurs, it can trigger other earthquakes nearby in what seismologists call an earthquake sequence. In most sequences, these later earthquakes will be smaller than the first one. The first, largest earthquake is called the mainshock and the later, smaller earthquakes are called aftershocks.
Occasionally, a new earthquake will be larger than any of the earlier events. When that happens, we call the new, largest earthquake the mainshock and we call all the earlier earthquakes in the sequence foreshocks. Observations show that the chance of an earthquake being followed by a larger one nearby and within a week is about 5%.
That 5% foreshock probability varies with the activity level of an aftershock sequence. Some earthquakes will have more or fewer aftershocks than average making them more or less likely to be followed by a larger earthquake, respectively. The USGS releases aftershock forecasts for all mainshocks with magnitude greater than 5 in the U.S. and its territories. These forecasts provide more accurate estimates of aftershock and foreshock probabilities.
Learn more:
Related

What is seismic hazard? What is a seismic hazard map and how are they used? What is seismic hazard? What is a seismic hazard map and how are they used?
Seismic hazard is the hazard associated with potential earthquakes in a particular area, and a seismic hazard map shows the relative hazards in different areas. The maps are made by considering what we currently know about: Past faults and earthquakes The behavior of seismic waves as they travel through different parts of the U.S. crust The near-surface site conditions at specific locations of...

What are the earthquake hazards/risks where I live? What are the earthquake hazards/risks where I live?
Determining your risk with regard to earthquakes, or more precisely shaking from earthquakes, isn't as simple as finding the nearest fault. The chances of experiencing shaking from an earthquake and/or having property damage is dependent on many different factors. The National Hazard Maps use all available data to estimate the chances of shaking (of different strengths and frequencies) across the...

How will my house hold up in an earthquake? Can the USGS send someone out to evaluate my property? How will my house hold up in an earthquake? Can the USGS send someone out to evaluate my property?
Published maps will only provide generalized, uninterpreted information about specific areas. Every property consists of a unique combination of geologic and structural factors that must be considered to determine what might happen to a house during an earthquake. Therefore, an individual site study is necessary. Geologic factors include: type of underlying material, depth to bedrock, depth of...

How do earthquakes affect buildings? How do earthquakes affect buildings?
Ground shaking is the primary cause of earthquake damage to man-made structures. Many factors influence the strength of earthquake shaking at a site including the earthquake's magnitude, the site's proximity to the fault, the local geology, and the soil type. More than 250 structures throughout the United States have been outfitted with seismic sensors by the USGS National Strong Motion Project...

What is the difference between earthquake early warning, earthquake forecasts, earthquake probabilities, and earthquake prediction? What is the difference between earthquake early warning, earthquake forecasts, earthquake probabilities, and earthquake prediction?
The USGS uses these four terms to refer to four different things. Early warning is a notification that is issued after an earthquake starts. Probabilities and forecasts are comparable to climate probabilities and weather forecasts, while predictions are more like statements of when, where, and how large, which is not yet possible for earthquakes. Here are more detailed descriptions of each...

How are engineers working to make roads and buildings safer? How are engineers working to make roads and buildings safer?
Earthquake engineers are working to make roads and buildings safer in the event of major earthquakes. This includes both improving the design of new buildings and bridges as well as strengthening older units to incorporate the latest advances in seismic and structural engineering. The Federal Emergency Management Agency plays a central role in funding research and development for the purpose of...

What is the USGS doing to mitigate and respond to earthquake hazards? What is the USGS doing to mitigate and respond to earthquake hazards?
The U.S. Geological Survey performs the following functions related to earthquake hazard mitigation: Receives, analyzes, maintains, and distributes data on earthquake activity worldwide. Satellites link our National Earthquake Information Center in Golden, Colorado to a network of seismograph stations. These stations, located throughout the world, are maintained by the U.S. Geological Survey...
Foreshocks, aftershocks - what's the difference? Foreshocks, aftershocks - what's the difference?
"Foreshock" and "aftershock" are relative terms. Foreshocks are earthquakes that precede larger earthquakes in the same location. An earthquake cannot be identified as a foreshock until after a larger earthquake in the same area occurs. Aftershocks are smaller earthquakes that occur in the same general area during the days to years following a larger event or "mainshock." They occur within 1-2...
What is the difference between aftershocks and swarms? What is the difference between aftershocks and swarms?
Aftershocks are a sequence of earthquakes that happen after a larger mainshock on a fault. Aftershocks occur near the fault zone where the mainshock rupture occurred and are part of the "readjustment process” after the main slip on the fault. Aftershocks become less frequent with time, although they can continue for days, weeks, months, or even years for a very large mainshock. A swarm, on the...
Earthquake-damaged building
Building damanged by the February 2011 earthquake in Christchurch, New Zealand.
Related
What is seismic hazard? What is a seismic hazard map and how are they used? What is seismic hazard? What is a seismic hazard map and how are they used?
Seismic hazard is the hazard associated with potential earthquakes in a particular area, and a seismic hazard map shows the relative hazards in different areas. The maps are made by considering what we currently know about: Past faults and earthquakes The behavior of seismic waves as they travel through different parts of the U.S. crust The near-surface site conditions at specific locations of...
What are the earthquake hazards/risks where I live? What are the earthquake hazards/risks where I live?
Determining your risk with regard to earthquakes, or more precisely shaking from earthquakes, isn't as simple as finding the nearest fault. The chances of experiencing shaking from an earthquake and/or having property damage is dependent on many different factors. The National Hazard Maps use all available data to estimate the chances of shaking (of different strengths and frequencies) across the...
How will my house hold up in an earthquake? Can the USGS send someone out to evaluate my property? How will my house hold up in an earthquake? Can the USGS send someone out to evaluate my property?
Published maps will only provide generalized, uninterpreted information about specific areas. Every property consists of a unique combination of geologic and structural factors that must be considered to determine what might happen to a house during an earthquake. Therefore, an individual site study is necessary. Geologic factors include: type of underlying material, depth to bedrock, depth of...
How do earthquakes affect buildings? How do earthquakes affect buildings?
Ground shaking is the primary cause of earthquake damage to man-made structures. Many factors influence the strength of earthquake shaking at a site including the earthquake's magnitude, the site's proximity to the fault, the local geology, and the soil type. More than 250 structures throughout the United States have been outfitted with seismic sensors by the USGS National Strong Motion Project...
What is the difference between earthquake early warning, earthquake forecasts, earthquake probabilities, and earthquake prediction? What is the difference between earthquake early warning, earthquake forecasts, earthquake probabilities, and earthquake prediction?
The USGS uses these four terms to refer to four different things. Early warning is a notification that is issued after an earthquake starts. Probabilities and forecasts are comparable to climate probabilities and weather forecasts, while predictions are more like statements of when, where, and how large, which is not yet possible for earthquakes. Here are more detailed descriptions of each...
How are engineers working to make roads and buildings safer? How are engineers working to make roads and buildings safer?
Earthquake engineers are working to make roads and buildings safer in the event of major earthquakes. This includes both improving the design of new buildings and bridges as well as strengthening older units to incorporate the latest advances in seismic and structural engineering. The Federal Emergency Management Agency plays a central role in funding research and development for the purpose of...
What is the USGS doing to mitigate and respond to earthquake hazards? What is the USGS doing to mitigate and respond to earthquake hazards?
The U.S. Geological Survey performs the following functions related to earthquake hazard mitigation: Receives, analyzes, maintains, and distributes data on earthquake activity worldwide. Satellites link our National Earthquake Information Center in Golden, Colorado to a network of seismograph stations. These stations, located throughout the world, are maintained by the U.S. Geological Survey...
Foreshocks, aftershocks - what's the difference? Foreshocks, aftershocks - what's the difference?
"Foreshock" and "aftershock" are relative terms. Foreshocks are earthquakes that precede larger earthquakes in the same location. An earthquake cannot be identified as a foreshock until after a larger earthquake in the same area occurs. Aftershocks are smaller earthquakes that occur in the same general area during the days to years following a larger event or "mainshock." They occur within 1-2...
What is the difference between aftershocks and swarms? What is the difference between aftershocks and swarms?
Aftershocks are a sequence of earthquakes that happen after a larger mainshock on a fault. Aftershocks occur near the fault zone where the mainshock rupture occurred and are part of the "readjustment process” after the main slip on the fault. Aftershocks become less frequent with time, although they can continue for days, weeks, months, or even years for a very large mainshock. A swarm, on the...
Earthquake-damaged building
Building damanged by the February 2011 earthquake in Christchurch, New Zealand.
Building damanged by the February 2011 earthquake in Christchurch, New Zealand.
Updated Date: July 8, 2024