
Estimating trends for greater sage-grouse populations within highly stochastic environments
Land and wildlife managers require accurate estimates of sensitive species’ trends to help guide conservation decisions that maintain biodiversity and promote healthy ecosystems. The U.S. Geological Survey (USGS), in conjunction with Colorado State University (CSU), developed a hierarchical population monitoring framework for managing greater sage-grouse (Centrocercus urophasianus; sage-grouse) populations and the sagebrush ecosystems on which they depend for survival and reproduction.
Producing reliable estimates of sage-grouse trends was a key component of that framework. Techniques implemented accounted for imperfect detection of birds on leks, incomplete time series data for most leks, and environmental factors that can lead to patterns of changes in abundance. Results represent trends for sage-grouse populations across their U.S. range, corrected for multiple sources of observation error, including nadir-to-nadir inference that accounts for natural changes in abundance. Improvements over prior modeling techniques enabled the inclusion of a greater number of populations in analyses, yielding trend estimates with higher spatial and temporal resolution.

Additional Framework Components
Explore other components of the Greater Sage-Grouse Monitoring Framework or return to the framework's homepage using the links below.
Background
A substantial challenge in estimating sage-grouse population trends is the incomplete count data associated with many leks. Previous studies addressed this by excluding populations with irregular data, but doing so restricts the ability to estimate trends across time and space. Sage-grouse populations fluctuate over time, a phenomenon that is best explained by cyclic climatic conditions that influence food and habitat availability. This relationship results in a pattern that repeats every 6–12 years, consisting of relatively short increases and decreases in population size that can confound long-term trends and lead to false interpretations of population performance. As such, studies of sage-grouse population trends are more robust when they consider datasets spanning multiple decades and restrict inference to years corresponding to one or more complete oscillations.
Research Objective
Our objective was to estimate trends of sage-grouse populations across their distribution in the United States in a manner that addressed multiple obstacles: (1) birds are imperfectly detected at leks, (2) leks often exhibit an incomplete time series of annual counts, and (3) most populations exhibit a regularly fluctuating pattern of abundance regardless of trend.
Methods
We implemented a modeling approach that enabled information to be shared across groups of similar leks, allowing population abundance to be estimated for every lek and year. Our approach accounted for variable sampling effort over time and issues with imperfect detection.
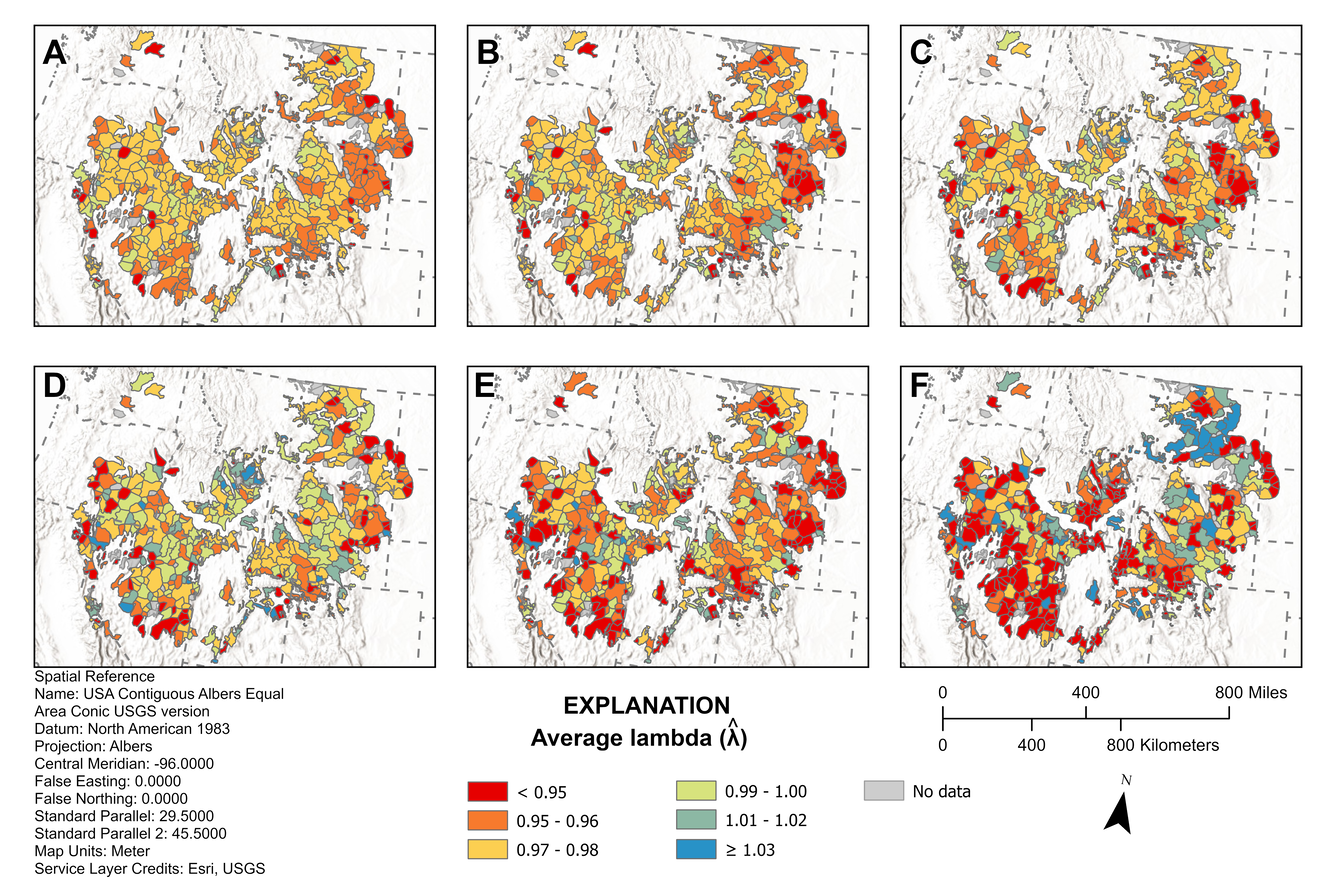
We restricted population trend inferences to complete oscillations and examined multiple time periods, each containing a different number of complete oscillations over the past six decades (1960–2024). We used population abundance nadirs (low points) rather than apexes (high points) to define start-stop temporal scales of inference. Population nadirs were considered more relevant for managers since populations are at greater risk of local extirpation when abundance is low.
Results and Implications
Our model estimated a 2.9% annual rate of decline for sage-grouse populations range-wide over the past six decades. Cumulative declines were 41.2, 64.1, and 78.8 percent range-wide in Period 5 (19 years), Period 3 (35 years), and Period 1 (55 years), respectively. Most populations range-wide experienced above-average abundance between the 1960s and early 1980s. A period that began in the late 1980s and ended around 2016 was marked by a substantial decline in sage-grouse numbers and coincided with widespread drought. Sage-grouse populations across the range were reduced to smaller sizes as an apparent result of this drought and have yet to recover to pre-1980s numbers. The greatest declines were observed in the western portion of the species’ range, where populations have been hardest hit by wildfire and by the conversion of sagebrush to invasive grasslands. Conversely, the eastern portion of the range, and Western Wyoming in particular, continues to harbor the largest population sizes based on the average number of males per lek. Maintaining high-quality habitats within those areas may ensure the viability and resilience of populations to future drought.

Future co-production
We continue working with all collaborators to improve sage-grouse management tools. Each year we develop an updated version of a range-wide standardized lek count database to include new counts and historical corrections (e.g., transfer of paper records to digital files) with improvements to data quality using rigorous quality control (quality assurance) methods. These data are incorporated into the hierarchical population modeling framework to produce results that are delivered in time for annual decision-making. Because sage-grouse populations oscillate at 6–12-year intervals, population trends may change more slowly depending on the timing of the interval.
Data restrictions
State wildlife agencies collect and manage lek databases. Because sage-grouse are a species of conservation concern and sensitive to activities during breeding, these data are available only after acquiring formal data-sharing agreements with individual states.
Funders
U.S. Geological Survey (Ecosystem Mission Area, Land Management Research Program and Species Management Research Program; Wyoming Landscape Conservation Initiative) and the Bureau of Land Management.
Partners
State Wildlife Agencies (California Department of Fish and Wildlife; Colorado Parks and Wildlife; Idaho Department of Fish and Game; Montana Fish, Wildlife & Parks; Nevada Department of Wildlife; North Dakota Game and Fish Department; Oregon Department of Fish and Wildlife; South Dakota Department of Game, Fish and Parks; Utah Division of Wildlife Resources; Wyoming Game and Fish Department; Washington Department of Fish and Wildlife), Colorado State University, BLM, US Fish and Wildlife Service, US Forest Service, researchers who provided field data to evaluate results.

Greater Sage-Grouse Population Monitoring Framework: Trends Analysis Information Sheet

Data Harmonization for Greater Sage-Grouse Populations

Greater Sage-Grouse Population Monitoring Framework: Frequently Asked Questions

Greater Sage-Grouse Population Monitoring Framework: Glossary of Terms

Greater Sage-Grouse Population Monitoring Framework

A user-friendly decision support tool for monitoring and managing greater sage-grouse populations

A targeted annual warning system (TAWS) for identifying aberrant declines in greater sage-grouse populations

Hierarchical Units of Greater Sage-Grouse Populations Informing Wildlife Management
Land and wildlife managers require accurate estimates of sensitive species’ trends to help guide conservation decisions that maintain biodiversity and promote healthy ecosystems. The U.S. Geological Survey (USGS), in conjunction with Colorado State University (CSU), developed a hierarchical population monitoring framework for managing greater sage-grouse (Centrocercus urophasianus; sage-grouse) populations and the sagebrush ecosystems on which they depend for survival and reproduction.
Producing reliable estimates of sage-grouse trends was a key component of that framework. Techniques implemented accounted for imperfect detection of birds on leks, incomplete time series data for most leks, and environmental factors that can lead to patterns of changes in abundance. Results represent trends for sage-grouse populations across their U.S. range, corrected for multiple sources of observation error, including nadir-to-nadir inference that accounts for natural changes in abundance. Improvements over prior modeling techniques enabled the inclusion of a greater number of populations in analyses, yielding trend estimates with higher spatial and temporal resolution.
Additional Framework Components
Explore other components of the Greater Sage-Grouse Monitoring Framework or return to the framework's homepage using the links below.
Background
A substantial challenge in estimating sage-grouse population trends is the incomplete count data associated with many leks. Previous studies addressed this by excluding populations with irregular data, but doing so restricts the ability to estimate trends across time and space. Sage-grouse populations fluctuate over time, a phenomenon that is best explained by cyclic climatic conditions that influence food and habitat availability. This relationship results in a pattern that repeats every 6–12 years, consisting of relatively short increases and decreases in population size that can confound long-term trends and lead to false interpretations of population performance. As such, studies of sage-grouse population trends are more robust when they consider datasets spanning multiple decades and restrict inference to years corresponding to one or more complete oscillations.
Research Objective
Our objective was to estimate trends of sage-grouse populations across their distribution in the United States in a manner that addressed multiple obstacles: (1) birds are imperfectly detected at leks, (2) leks often exhibit an incomplete time series of annual counts, and (3) most populations exhibit a regularly fluctuating pattern of abundance regardless of trend.
Methods
We implemented a modeling approach that enabled information to be shared across groups of similar leks, allowing population abundance to be estimated for every lek and year. Our approach accounted for variable sampling effort over time and issues with imperfect detection.
We restricted population trend inferences to complete oscillations and examined multiple time periods, each containing a different number of complete oscillations over the past six decades (1960–2024). We used population abundance nadirs (low points) rather than apexes (high points) to define start-stop temporal scales of inference. Population nadirs were considered more relevant for managers since populations are at greater risk of local extirpation when abundance is low.
Results and Implications
Our model estimated a 2.9% annual rate of decline for sage-grouse populations range-wide over the past six decades. Cumulative declines were 41.2, 64.1, and 78.8 percent range-wide in Period 5 (19 years), Period 3 (35 years), and Period 1 (55 years), respectively. Most populations range-wide experienced above-average abundance between the 1960s and early 1980s. A period that began in the late 1980s and ended around 2016 was marked by a substantial decline in sage-grouse numbers and coincided with widespread drought. Sage-grouse populations across the range were reduced to smaller sizes as an apparent result of this drought and have yet to recover to pre-1980s numbers. The greatest declines were observed in the western portion of the species’ range, where populations have been hardest hit by wildfire and by the conversion of sagebrush to invasive grasslands. Conversely, the eastern portion of the range, and Western Wyoming in particular, continues to harbor the largest population sizes based on the average number of males per lek. Maintaining high-quality habitats within those areas may ensure the viability and resilience of populations to future drought.
Future co-production
We continue working with all collaborators to improve sage-grouse management tools. Each year we develop an updated version of a range-wide standardized lek count database to include new counts and historical corrections (e.g., transfer of paper records to digital files) with improvements to data quality using rigorous quality control (quality assurance) methods. These data are incorporated into the hierarchical population modeling framework to produce results that are delivered in time for annual decision-making. Because sage-grouse populations oscillate at 6–12-year intervals, population trends may change more slowly depending on the timing of the interval.
Data restrictions
State wildlife agencies collect and manage lek databases. Because sage-grouse are a species of conservation concern and sensitive to activities during breeding, these data are available only after acquiring formal data-sharing agreements with individual states.
Funders
U.S. Geological Survey (Ecosystem Mission Area, Land Management Research Program and Species Management Research Program; Wyoming Landscape Conservation Initiative) and the Bureau of Land Management.
Partners
State Wildlife Agencies (California Department of Fish and Wildlife; Colorado Parks and Wildlife; Idaho Department of Fish and Game; Montana Fish, Wildlife & Parks; Nevada Department of Wildlife; North Dakota Game and Fish Department; Oregon Department of Fish and Wildlife; South Dakota Department of Game, Fish and Parks; Utah Division of Wildlife Resources; Wyoming Game and Fish Department; Washington Department of Fish and Wildlife), Colorado State University, BLM, US Fish and Wildlife Service, US Forest Service, researchers who provided field data to evaluate results.
Greater Sage-Grouse Population Monitoring Framework: Trends Analysis Information Sheet
Data Harmonization for Greater Sage-Grouse Populations
Greater Sage-Grouse Population Monitoring Framework: Frequently Asked Questions
Greater Sage-Grouse Population Monitoring Framework: Glossary of Terms
Greater Sage-Grouse Population Monitoring Framework
A user-friendly decision support tool for monitoring and managing greater sage-grouse populations
A targeted annual warning system (TAWS) for identifying aberrant declines in greater sage-grouse populations