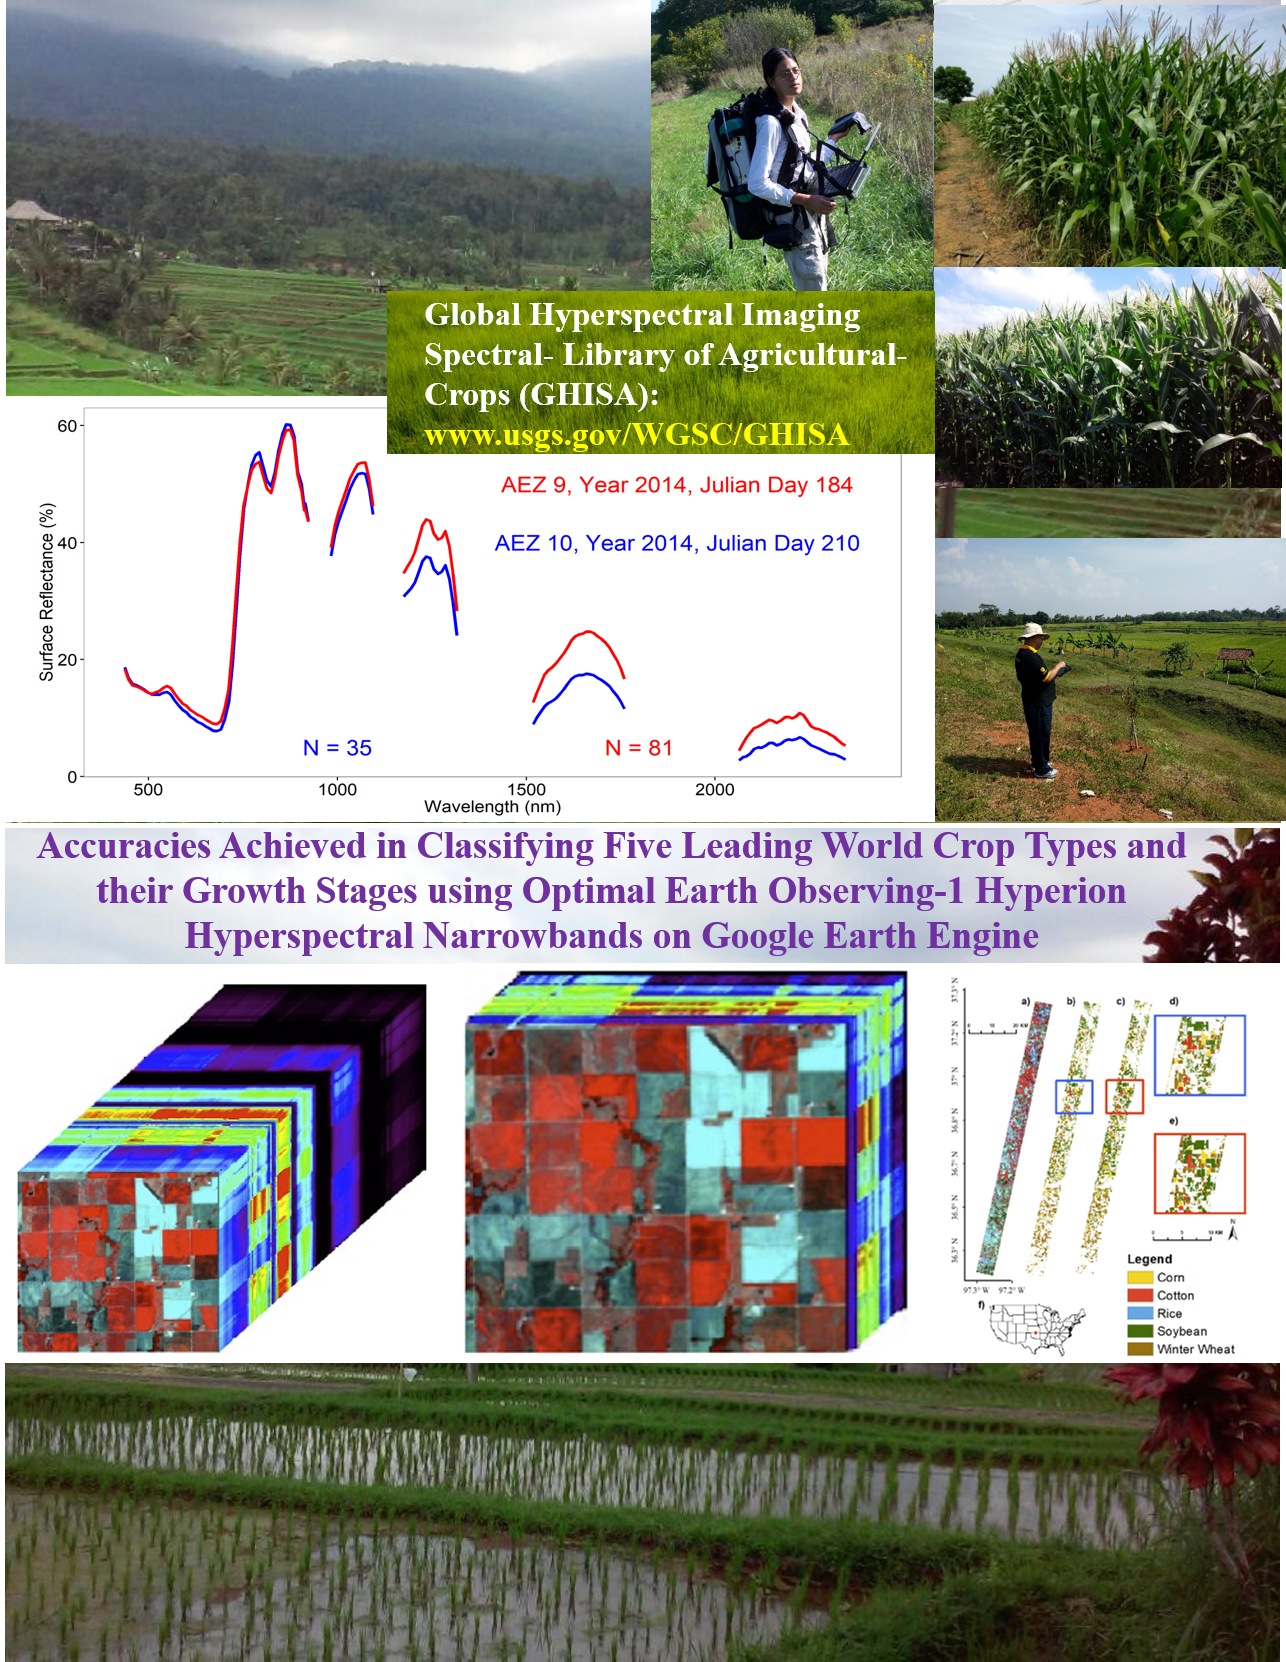
Figure A - GHISA

Detailed Description
Figure A. Illustration of Global Hyperspectral Imaging Spectral-Library of Agricultural-crops (GHISA). Figure illustrates GHISA hyperspectral signature of corn crop obtained for year 2014 from two separate farms: one in a farm within AEZ 9 for Julian day 184 versus another from a farm within AEZ10 for Julian day 210. Hyperspectral signature obtained from Earth Observing-1 (EO-1) Hyperion Satellite Images. Corn crop is in late growth stages of both dates, although somewhat different growth phase within the late growth stage due to differences in acquisition of images (Julian day 184 versus Julian day 210). The two hyperspectral signatures are qualitatively matched here for "spectral matching" comparisons. Quantitative spectral matching techniques such as the spectral correlation similarity (SCS) and spectral similarity value (SSV) will help match quantitatively two or more hyperspectral signatures for their match in shape as well as magnitude. SCS R-square value provides shape match whereas SSV values provide both shape and magnitude match of the hyperspectral signatures. Note: for GHISA initial paper, please refer to Aneece and Thenkabail, 2018. For spectral matching techniques, see the paper by Thenkabail et al. (2007).
Aneece, I.; Thenkabail, P. Accuracies Achieved in Classifying Five Leading World Crop Types and their Growth Stages Using Optimal Earth Observing-1 Hyperion Hyperspectral Narrowbands on Google Earth Engine. Remote Sensing . 2018, 10, 2027. https://www.mdpi.com/2072-4292/10/12/2027
Thenkabail, P.S., GangadharaRao, P., Biggs, T., Krishna, M., and Turral, H., 2007. Spectral Matching Techniques to Determine Historical Land use/Land cover (LULC) and Irrigated Areas using Time-series AVHRR Pathfinder Datasets in the Krishna River Basin, India. Photogrammetric Engineering and Remote Sensing. 73(9): 1029-1040. (Second Place Recipients of the 2008 John I. Davidson ASPRS President’s Award for Practical papers).
Sources/Usage
Courtesy: Prasad Thenkabail


