
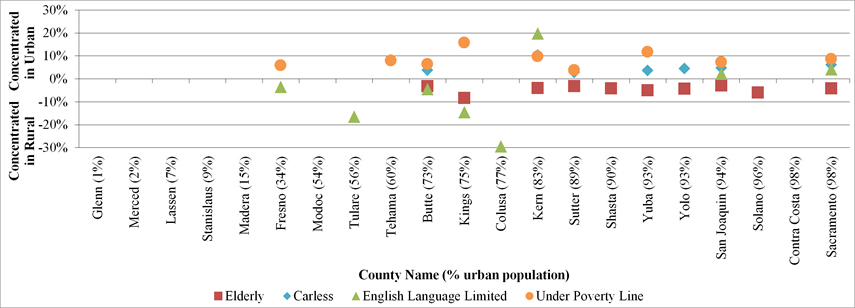
Graph of ARkStorm population exposure in rural and urban areas
By Western Geographic Science Center
2014 (approx.)

Detailed Description
Difference in population concentrations in and out of the ARkStorm flood zone. Note: counties ordered by percentage of the county population that is flooded, with only statistically significant difference in population proportions displayed.
Sources/Usage
Public Domain.
Related

ARkStorm
The SAFRR project’s second scenario, called ARkStorm, addresses massive U.S. West Coast storms analogous to those that devastated California in 1861–62. Storms of this magnitude are projected to become more frequent and intense as a result of climate change. The SAFRR project assembled experts from scientific research agencies to design the large, but scientifically plausible, hypothetical storm...
Related
ARkStorm
The SAFRR project’s second scenario, called ARkStorm, addresses massive U.S. West Coast storms analogous to those that devastated California in 1861–62. Storms of this magnitude are projected to become more frequent and intense as a result of climate change. The SAFRR project assembled experts from scientific research agencies to design the large, but scientifically plausible, hypothetical storm...