
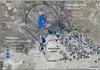
Well-withdrawal footprint map, Azraq Oasis, Jordan
By Pennsylvania Water Science Center
2010 (approx.)

Detailed Description
Large groundwater withdrawals in the Azraq Oasis area, Jordan, have contributed to declining water levels in wells. This map shows the withdrawal footprint and observed water-level trends (labeled triangular symbols, from Goode et al. 2013). The footprint depth-rate index is 0.1 meter per year (m/yr), corresponding to a water-level decline rate of 1 m/yr, scaled by a specific yield of 0.1. (All hydrologic data provided by Jordan Ministry of Water and Irrigation; imagery ESRI 2015)
Sources/Usage
Public Domain.
Related
Visualization of groundwater withdrawals Visualization of groundwater withdrawals
Generating an informative display of groundwater withdrawals can sometimes be difficult because the symbols for closely spaced wells can overlap. An alternative method for displaying groundwater withdrawals is to generate a “footprint” of the withdrawals. WellFootprint version 1.0 implements the Footprint algorithm with two optional variations that can speed up the footprint calculation...
Authors
Richard B. Winston, Daniel J. Goode
Map visualization of groundwater withdrawals at the sub-basin scale Map visualization of groundwater withdrawals at the sub-basin scale
A simple method is proposed to visualize the magnitude of groundwater withdrawals from wells relative to user-defined water-resource metrics. The map is solely an illustration of the withdrawal magnitudes, spatially centered on wells—it is not capture zones or source areas contributing recharge to wells. Common practice is to scale the size (area) of withdrawal well symbols proportional...
Authors
Daniel J. Goode
Groundwater-level trends and forecasts, and salinity trends, in the Azraq, Dead Sea, Hammad, Jordan Side Valleys, Yarmouk, and Zarqa groundwater basins, Jordan Groundwater-level trends and forecasts, and salinity trends, in the Azraq, Dead Sea, Hammad, Jordan Side Valleys, Yarmouk, and Zarqa groundwater basins, Jordan
Changes in groundwater levels and salinity in six groundwater basins in Jordan were characterized by using linear trends fit to well-monitoring data collected from 1960 to early 2011. On the basis of data for 117 wells, groundwater levels in the six basins were declining, on average about -1 meter per year (m/yr), in 2010. The highest average rate of decline, -1.9 m/yr, occurred in the...
Authors
Daniel J. Goode, Lisa A. Senior, Ali Subah, Ayman Jaber
Wellfootprint - A Map App for Visualizing Groundwater Withdrawals Wellfootprint - A Map App for Visualizing Groundwater Withdrawals
Wellfootprint computes a raster map of groundwater withdrawals relative to a user-defined "Depth-Rate Index" (DRI), such as a recharge rate. Dividing each well's withdrawal rate by the length per time DRI yields an area for display for each well's 'footprint' as a circle around each well. Symbols for closely spaced wells are merged to visualize the combined withdrawals eq