
Images
Images related to natural hazards.
Filter Total Items: 7275

Kīlauea Volcano — Halema‘uma‘u Crater

Fissure 8 lava flow front had completely filled Kapoho Bay.
Fissure 8 lava flow front had completely filled Kapoho Bay.As of the morning of June 5, the fissure 8 lava flow front had completely filled Kapoho Bay.
Fissure 8 lava flow front had completely filled Kapoho Bay.
Fissure 8 lava flow front had completely filled Kapoho Bay.As of the morning of June 5, the fissure 8 lava flow front had completely filled Kapoho Bay.

Kīlauea LERZ lava flows and fissures, June 5, 10:00 a.m.
Kīlauea LERZ lava flows and fissures, June 5, 10:00 a.m.Map as of 10:00 a.m. HST, June 5, 2018. Given the dynamic nature of Kīlauea's lower East Rift Zone eruption, with changing vent locations, fissures starting and stopping, and varying rates of lava effusion, map details shown here are accurate as of the date/time noted. Shaded purple areas indicate lava flows erupted in 1840, 1955, 1960, and 2014-2015.

Aerial view into Halema‘uma‘u. Explosions and collapse have enlarge...
Aerial view into Halema‘uma‘u. Explosions and collapse have enlarge...HVO scientists captured this aerial view of a much-changed Halema‘uma‘u during their overflight of the summit on June 5, 2018. Explosions and collapse within Halema‘uma‘u have enlarged the crater (foreground) that previously hosted the summit lava lake, and the far rim of Halema‘uma‘u has dropped with continued summit deflation.

Whidbey Island snapshot west
A pair of video cameras overlook the coast along a beach on Whidbey Island, Island County at the northern boundary of Puget Sound in western Washington. View looks west out into the Strait of Juan de Fuca.
A pair of video cameras overlook the coast along a beach on Whidbey Island, Island County at the northern boundary of Puget Sound in western Washington. View looks west out into the Strait of Juan de Fuca.

View of ongoing rockfalls on the southern walls of the summit crater and ground
View of ongoing rockfalls on the southern walls of the summit crater and groundView of ongoing rockfalls on the southern walls of the summit crater and ground cracks just to the north of Halema‘uma‘u.
View of ongoing rockfalls on the southern walls of the summit crater and ground
View of ongoing rockfalls on the southern walls of the summit crater and groundView of ongoing rockfalls on the southern walls of the summit crater and ground cracks just to the north of Halema‘uma‘u.

A nodal seismometer can be easily deployed for a month in a closely...
A nodal seismometer can be easily deployed for a month in a closely...A nodal seismometer can be easily deployed for a month in a closely spaced array of tens of instruments. Arrays have been installed at Yellowstone National Park to map subsurface of geyser basins.

Kīlauea LERZ lava flows and fissures, June 4, 2:00 p.m.
Kīlauea LERZ lava flows and fissures, June 4, 2:00 p.m.Map as of 2:00 p.m. HST, June 4, 2018. Given the dynamic nature of Kīlauea's lower East Rift Zone eruption, with changing vent locations, fissures starting and stopping, and varying rates of lava effusion, map details shown here are accurate as of the date/time noted. Shaded purple areas indicate lava flows erupted in 1840, 1955, 1960, and 2014-2015.

Subbottom profiler system towed on pontoons
Subbottom profiler system towed on pontoons behind the R/V Petrel during the geophysical survey in May 2018
Subbottom profiler system towed on pontoons behind the R/V Petrel during the geophysical survey in May 2018

Kīlauea Volcano — Kapoho Bay Ocean Entry
Video from helicopter overflight of Kīlauea Volcano's lower East Rift Zone on June 4, 2018, shows lava from fissure 8 entering the ocean at Kapoho Bay. View to the north.
Video from helicopter overflight of Kīlauea Volcano's lower East Rift Zone on June 4, 2018, shows lava from fissure 8 entering the ocean at Kapoho Bay. View to the north.

Thermal map of fissure system and lava flows
This thermal map shows the fissure system and lava flows as of 12:30 pm on Sunday, June 3. The flow from Fissure 8 continues to advance and had a wide flow front advancing towards the ocean in Kapoho. The black and white area is the extent of the thermal map.
This thermal map shows the fissure system and lava flows as of 12:30 pm on Sunday, June 3. The flow from Fissure 8 continues to advance and had a wide flow front advancing towards the ocean in Kapoho. The black and white area is the extent of the thermal map.

Steamboat Geyser in the water-phase of an eruption, Jun 4, 2019
Steamboat Geyser in the water-phase of an eruption, Jun 4, 2019Steamboat Geyser in the water-phase of an eruption on June 4, 2018, Norris Geyser Basin, Yellowstone National Park.
Steamboat Geyser in the water-phase of an eruption, Jun 4, 2019
Steamboat Geyser in the water-phase of an eruption, Jun 4, 2019Steamboat Geyser in the water-phase of an eruption on June 4, 2018, Norris Geyser Basin, Yellowstone National Park.

Steamboat Geyser in the steam-phase of an eruption, Jun 4, 2019
Steamboat Geyser in the steam-phase of an eruption, Jun 4, 2019Steamboat Geyser in the steam-phase of an eruption on June 4, 2018, Norris Geyser Basin, Yellowstone National Park.
Steamboat Geyser in the steam-phase of an eruption, Jun 4, 2019
Steamboat Geyser in the steam-phase of an eruption, Jun 4, 2019Steamboat Geyser in the steam-phase of an eruption on June 4, 2018, Norris Geyser Basin, Yellowstone National Park.

Kīlauea Volcano — Fissure 8 Thermal Images
What a difference four days makes! These thermal images of fissure 8 fountains erupting on Kīlauea's lower East Rift Zone show a few things: 1) The lava fountains have gained height—with the tallest one growing from 150 ft to over 250 ft. 2) A pu‘u (cone) has built up downwind. 3) The amount of material wafting downwind is greater.
What a difference four days makes! These thermal images of fissure 8 fountains erupting on Kīlauea's lower East Rift Zone show a few things: 1) The lava fountains have gained height—with the tallest one growing from 150 ft to over 250 ft. 2) A pu‘u (cone) has built up downwind. 3) The amount of material wafting downwind is greater.

Thermal map of fissure system and lava flows
This thermal map shows the fissure system and lava flows as of 12:30 pm on Monday, June 4 The flow from Fissure 8 remains active, with the flow front entering the ocean in Kapoho Bay over the past day. The black and white area is the extent of the thermal map.
This thermal map shows the fissure system and lava flows as of 12:30 pm on Monday, June 4 The flow from Fissure 8 remains active, with the flow front entering the ocean in Kapoho Bay over the past day. The black and white area is the extent of the thermal map.

Multibeam-sonar data acquisition
Displays showing themultibeam-sonar data acquisition and the navigation system aboard the R/V Petrel during the geophysical survey in May 2018.
Displays showing themultibeam-sonar data acquisition and the navigation system aboard the R/V Petrel during the geophysical survey in May 2018.

Kīlauea Volcano — Advancing Lava Flow
Overflight photo at 7AM HST from offshore looking up the flowfront. Nearly all of the front was active and advancing/spreading.
Overflight photo at 7AM HST from offshore looking up the flowfront. Nearly all of the front was active and advancing/spreading.

Kīlauea Volcano — Advancing Flow
Photo from 7AM helicopter overflight, hovering offshore and looking up the flowfront. Nearly all of the front was active and advancing; advance rates were estimated at an average of 250 feet/hour (76 m/hr), and as of 7AM the flow was 500 yards (457 m) from the ocean.
Photo from 7AM helicopter overflight, hovering offshore and looking up the flowfront. Nearly all of the front was active and advancing; advance rates were estimated at an average of 250 feet/hour (76 m/hr), and as of 7AM the flow was 500 yards (457 m) from the ocean.

Thermal map of fissure system and lava flows
This thermal map shows the fissure system and lava flows as of 5:30 pm on Friday, June 1. The flow from Fissure 8 continues to advance in a northeast direction and the front was roughly 9.5 km (5.9 miles) from the vent at Fissure 8. The black and white area is the extent of the thermal map.
This thermal map shows the fissure system and lava flows as of 5:30 pm on Friday, June 1. The flow from Fissure 8 continues to advance in a northeast direction and the front was roughly 9.5 km (5.9 miles) from the vent at Fissure 8. The black and white area is the extent of the thermal map.

Thermal map of fissure system and lava flows
This thermal map shows the fissure system and lava flows as of 6:45 am on Saturday, June 2. The flow from Fissure 8 continues to advance in a northeast direction and the front was roughly 10.1 km (6.3 miles) from the vent at Fissure 8. The black and white area is the extent of the thermal map.
This thermal map shows the fissure system and lava flows as of 6:45 am on Saturday, June 2. The flow from Fissure 8 continues to advance in a northeast direction and the front was roughly 10.1 km (6.3 miles) from the vent at Fissure 8. The black and white area is the extent of the thermal map.
Slumping of west rim of Halema‘uma‘u
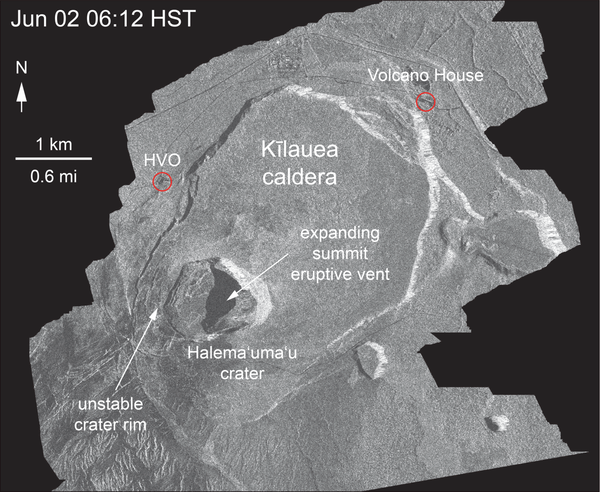
This animated GIF shows a sequence of radar amplitude images that were acquired by the Italian Space Agency's Cosmo-SkyMed satellite system. The images illustrate changes to the caldera area of Kīlauea Volcano that occurred between May 5 and June 2 at 6:00 p.m. HST.
This animated GIF shows a sequence of radar amplitude images that were acquired by the Italian Space Agency's Cosmo-SkyMed satellite system. The images illustrate changes to the caldera area of Kīlauea Volcano that occurred between May 5 and June 2 at 6:00 p.m. HST.