U.S. flag

An official website of the United States government

Multimedia

Images

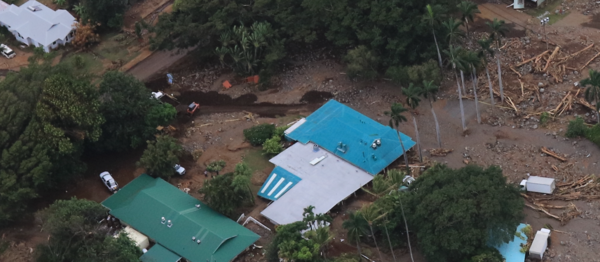
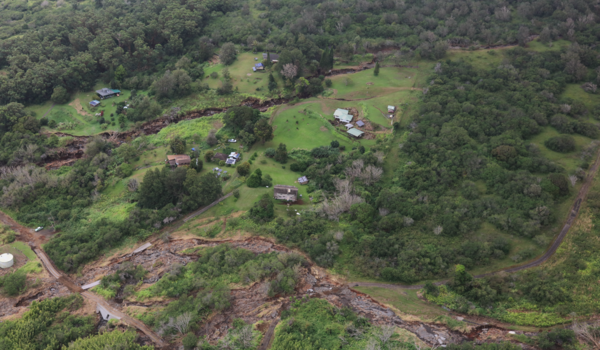
Photo of multiple landslide source areas
2026 Hurricane Lala landslide source areas

Field photo of landslide source areas from 2026 Hurricane Lala landslide response. Photograph by the U.S. Geological Survey.

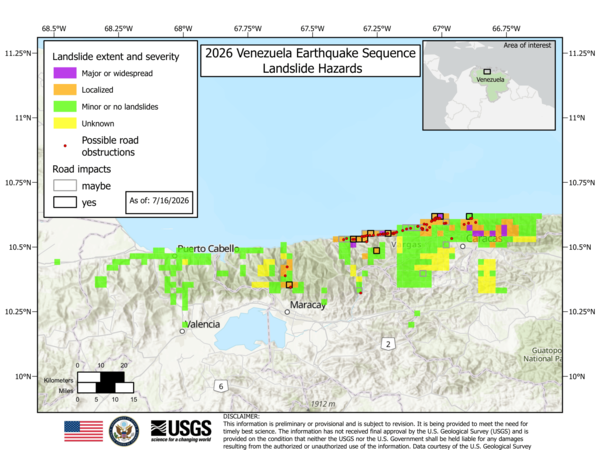
Map of road impacts from landslides
2026 Venezuela Earthquake Sequence - Landslide Hazards

USGS Imagery assessment of landslide extent and severity (as of 07/01/26, 4:30 PM MDT). Verification remains ongoing. Color is based on USGS’s remote assessment. Landslide impact is classified as “Unknown” (yellow), “Minor or none” (green), “Localized” (orange), or “Major or Widespread” (purple).

USGS Imagery assessment of landslide extent and severity (as of 07/01/26, 4:30 PM MDT). Verification remains ongoing. Color is based on USGS’s remote assessment. Landslide impact is classified as “Unknown” (yellow), “Minor or none” (green), “Localized” (orange), or “Major or Widespread” (purple).

Map depicting Valle De Lajas and Río Loco drainage, Puerto Rico

Map depicting Valle De Lajas and Río Loco drainage, the westernmost zone of the study area. Pie charts summarizing Sr isotope mixing model results. River sediment sample locations are represented by an X, bedrock sampling locations by open circles. An infilled black rectangle shows Bahía de Guánica sediment sampling location (NS-01).

Map depicting Valle De Lajas and Río Loco drainage, the westernmost zone of the study area. Pie charts summarizing Sr isotope mixing model results. River sediment sample locations are represented by an X, bedrock sampling locations by open circles. An infilled black rectangle shows Bahía de Guánica sediment sampling location (NS-01).

Electrical resistivity at lower-crustal depths (35 km) beneath the contiguous U.S. The architecture of the nation is revealed at this depth with warm colors marking active extension beneath the western U.S. The cratonic building blocks are resistive (cool colors) and were joined throughout geologic time along linear conductive sutures beneath the central and eastern U.S
CONUS Electrical resistivity at 35km

Electrical resistivity at lower-crustal depths (35 km) beneath the contiguous U.S. The architecture of the nation is revealed at this depth with warm colors marking active extension beneath the western U.S.

Electrical resistivity at lower-crustal depths (35 km) beneath the contiguous U.S. The architecture of the nation is revealed at this depth with warm colors marking active extension beneath the western U.S.

Videos

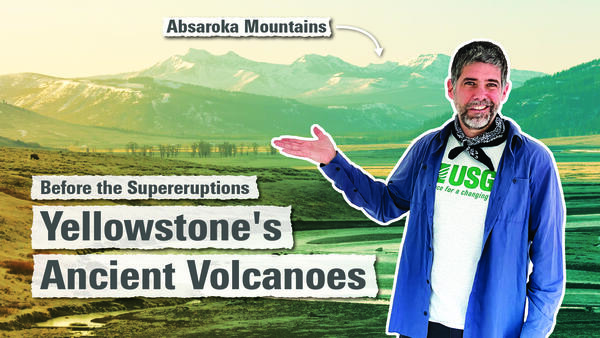
Man in blue shirt points to rugged snow-capped mountains in the background Man in blue shirt points to rugged snow-capped mountains in the background
Before the supereruptions: Yellowstone’s ancient volcanoes (Yellowstone monthly update – August 2026)

Long before explosive eruptions formed the Yellowstone Caldera and heat from the magmatic system began feeding a dynamic hydrothermal system, there was the Absaroka volcanic range. Remnants of the rugged terrain are still visible on the east and north sides of Yellowstone National Park.

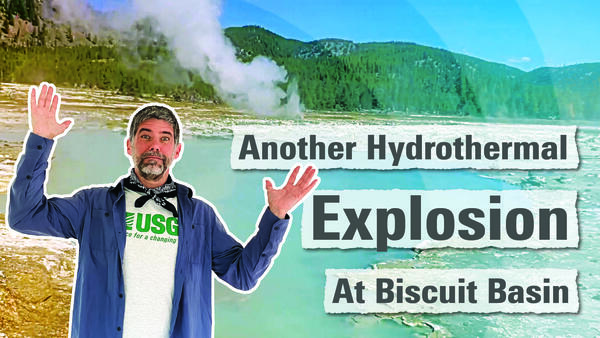
Man in blue shirt holding hands up with a blue pool and spouting geyser in the background Man in blue shirt holding hands up with a blue pool and spouting geyser in the background
Another hydrothermal explosion at Biscuit Basin (Yellowstone Monthly Update - June 2026)

On June 13, 2026, Yellowstone National Park’s newest geophysical monitoring sites captured a small hydrothermal explosion in Biscuit Basin! That story is the subject of this month’s video update.

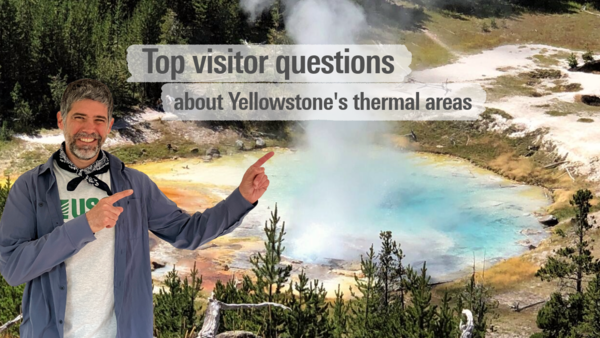
Smiling man in blue shirt pointing at rainbow-colored hot spring with text "Top Visitor Questions" Smiling man in blue shirt pointing at rainbow-colored hot spring with text "Top Visitor Questions"
Top visitor questions about Yellowstone's thermal areas (Yellowstone Monthly Update - June 2026)

Summer is here, and millions of people will be visiting Yellowstone National Park. People with questions. What is this scat I’m seeing? How does a geyser erupt? What makes Yellowstone so special?

Where’s the bathroom?

Main pointing to a barren mountainside with steam vents Main pointing to a barren mountainside with steam vents
Roaring Mountain (Yellowstone Monthly Update - May 2026)

Did you hear that???  Well, Roaring Mountain isn’t quite as loud as it used to be, but it’s still one of the hottest thermal areas in all of Yellowstone National Park!

Man gesturing in front of a barren landscape with title "The New Norris Hot Spring" Man gesturing in front of a barren landscape with title "The New Norris Hot Spring"
The New Norris Hot Spring (Yellowstone Monthly Update - March 2026)

KABOOM! That’s what Yellowstone is famous for – huge explosive volcanic eruptions. There’s really nothing brewing right now, the magma chamber is mostly solid, but there have been quite a few hydrothermal eruptions and small explosions in both Biscuit Basin and Norris Geyser Basin as water in the hydrothermal system flashes to steam.

KABOOM! That’s what Yellowstone is famous for – huge explosive volcanic eruptions. There’s really nothing brewing right now, the magma chamber is mostly solid, but there have been quite a few hydrothermal eruptions and small explosions in both Biscuit Basin and Norris Geyser Basin as water in the hydrothermal system flashes to steam.

Audio

Landers rupture
Landers rupture
Landers rupture
Landers Rupture — Sue on what it felt like
Landers rupture
Landers rupture
Landers rupture
Landers Rupture — Sue on what it felt like

USGS seismologist Susan Hough recalls what the 1992 Landers earthquake felt like from Pasadena, CA. 

Landers rupture
Landers rupture
Landers rupture
Landers Rupture — Scott on what it looked like
Landers rupture
Landers rupture
Landers rupture
Landers Rupture — Scott on what it looked like

USGS field technician Scott Lydeen recalls what the aftermath of the 1992 Landers earthquake looked like.

Landers rupture
Landers rupture
Landers rupture
Landers Rupture — Sue on how monitoring networks evolved
Landers rupture
Landers rupture
Landers rupture
Landers Rupture — Sue on how monitoring networks evolved

USGS seismologist Susan Hough described the Southern California Seismic Network and how it was used for the 1992 Landers earthquake.

Landers rupture
Landers rupture
Landers rupture
Landers Rupture — Where they were
Landers rupture
Landers rupture
Landers rupture
Landers Rupture — Where they were

USGS scientists remember where they were during the 1992 Landers earthquake in Southern California

Landers rupture
Landers rupture
Landers rupture
Landers Rupture — Andy on using satellite data
Landers rupture
Landers rupture
Landers rupture
Landers Rupture — Andy on using satellite data

USGS seismologist Andrew Michael talks about the remote location of the 1992 Landers earthquake and how researchers were able to use satellite data to better see the quake’s impacts.

USGS seismologist Andrew Michael talks about the remote location of the 1992 Landers earthquake and how researchers were able to use satellite data to better see the quake’s impacts.

Webcams

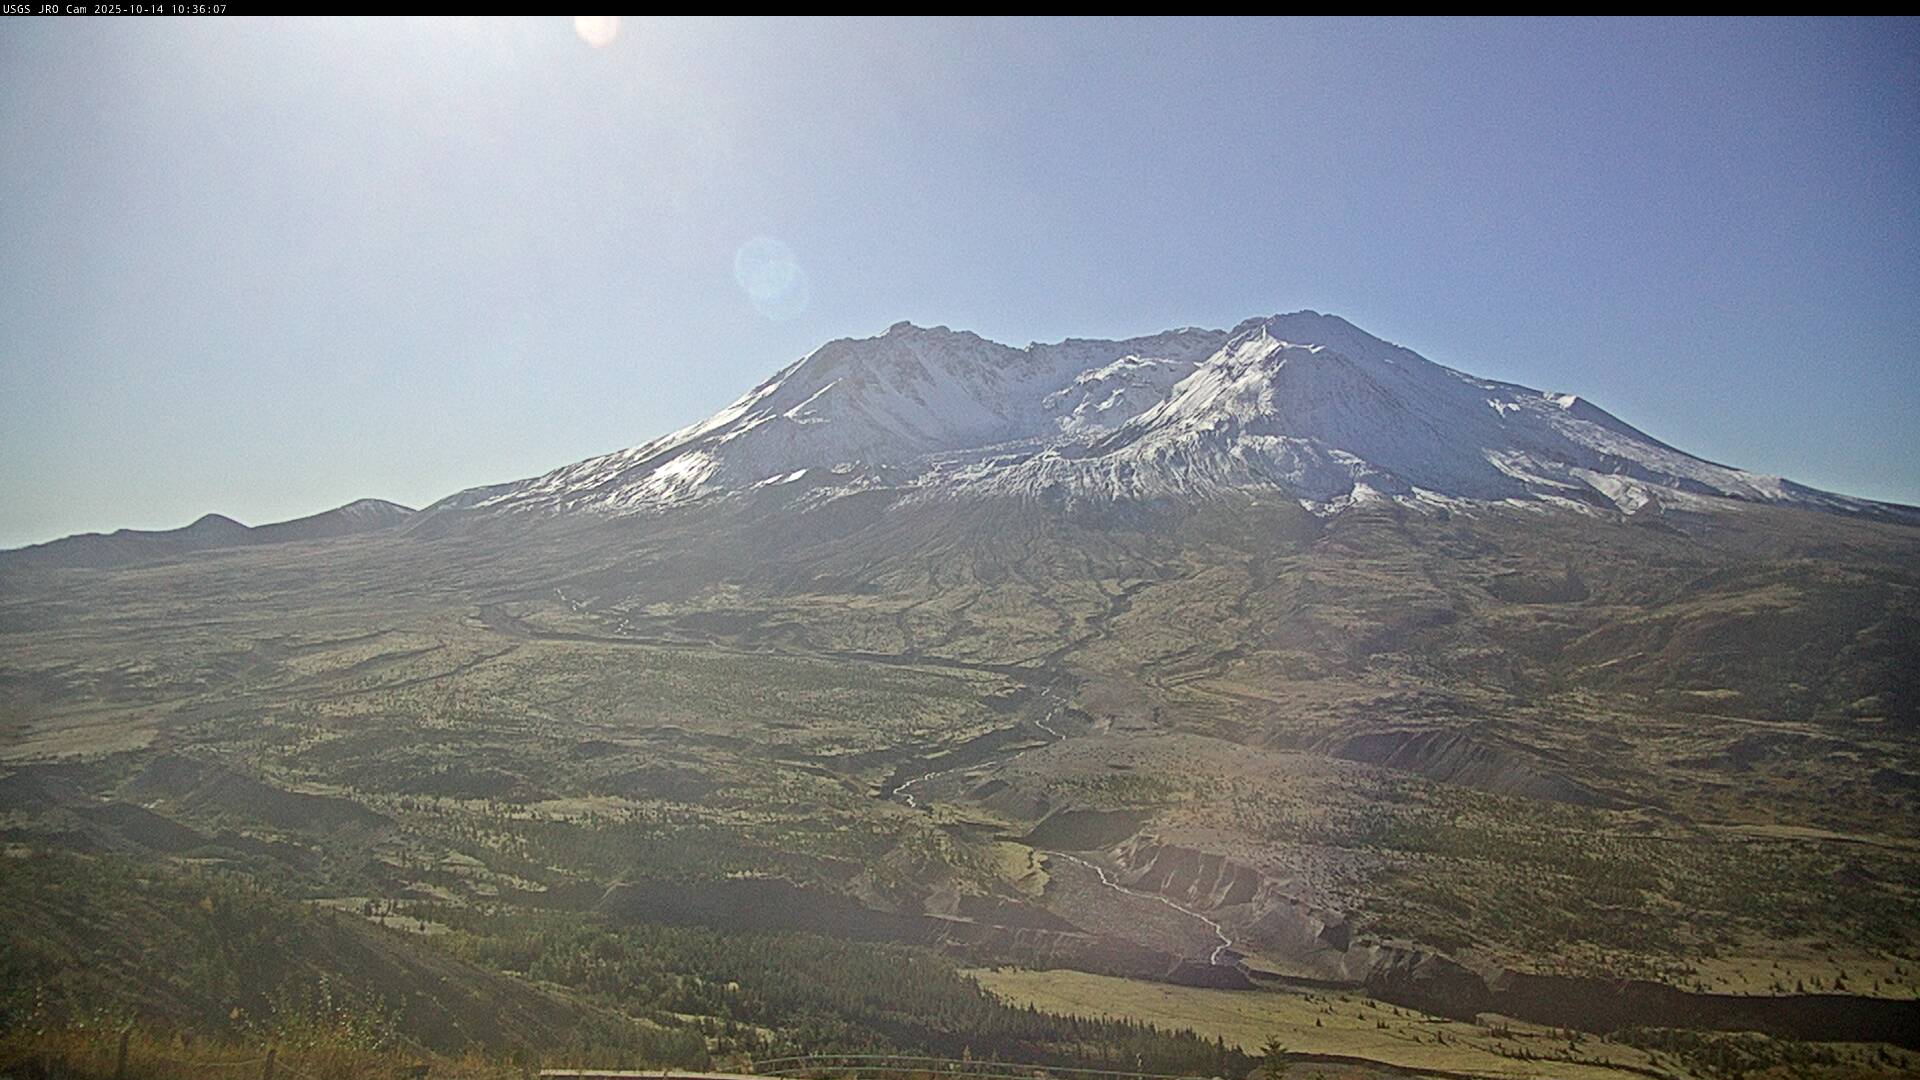
Image of Mount St. Helens looking south from north of the volcano
Johnston Ridge Observatory, Mount St. Helens

This static image is from a USGS Cascades Volcano Observatory research camera located at the Johnston Ridge Observatory, north of Mount St. Helens.  The view is to the south.  This camera is intended to assist the USGS with situational awareness. At times, clouds, rain, and snow obscure visibility.

This static image is from a USGS Cascades Volcano Observatory research camera located at the Johnston Ridge Observatory, north of Mount St. Helens.  The view is to the south.  This camera is intended to assist the USGS with situational awareness. At times, clouds, rain, and snow obscure visibility.

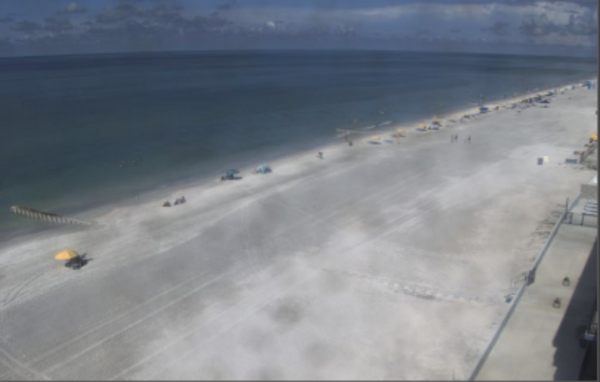
Zoomed-in view of a small section of the beach from Madeira Beach camera 2 shows tourists walking along the beach
Most recent snapshot at Madeira Beach, Florida, Camera 2
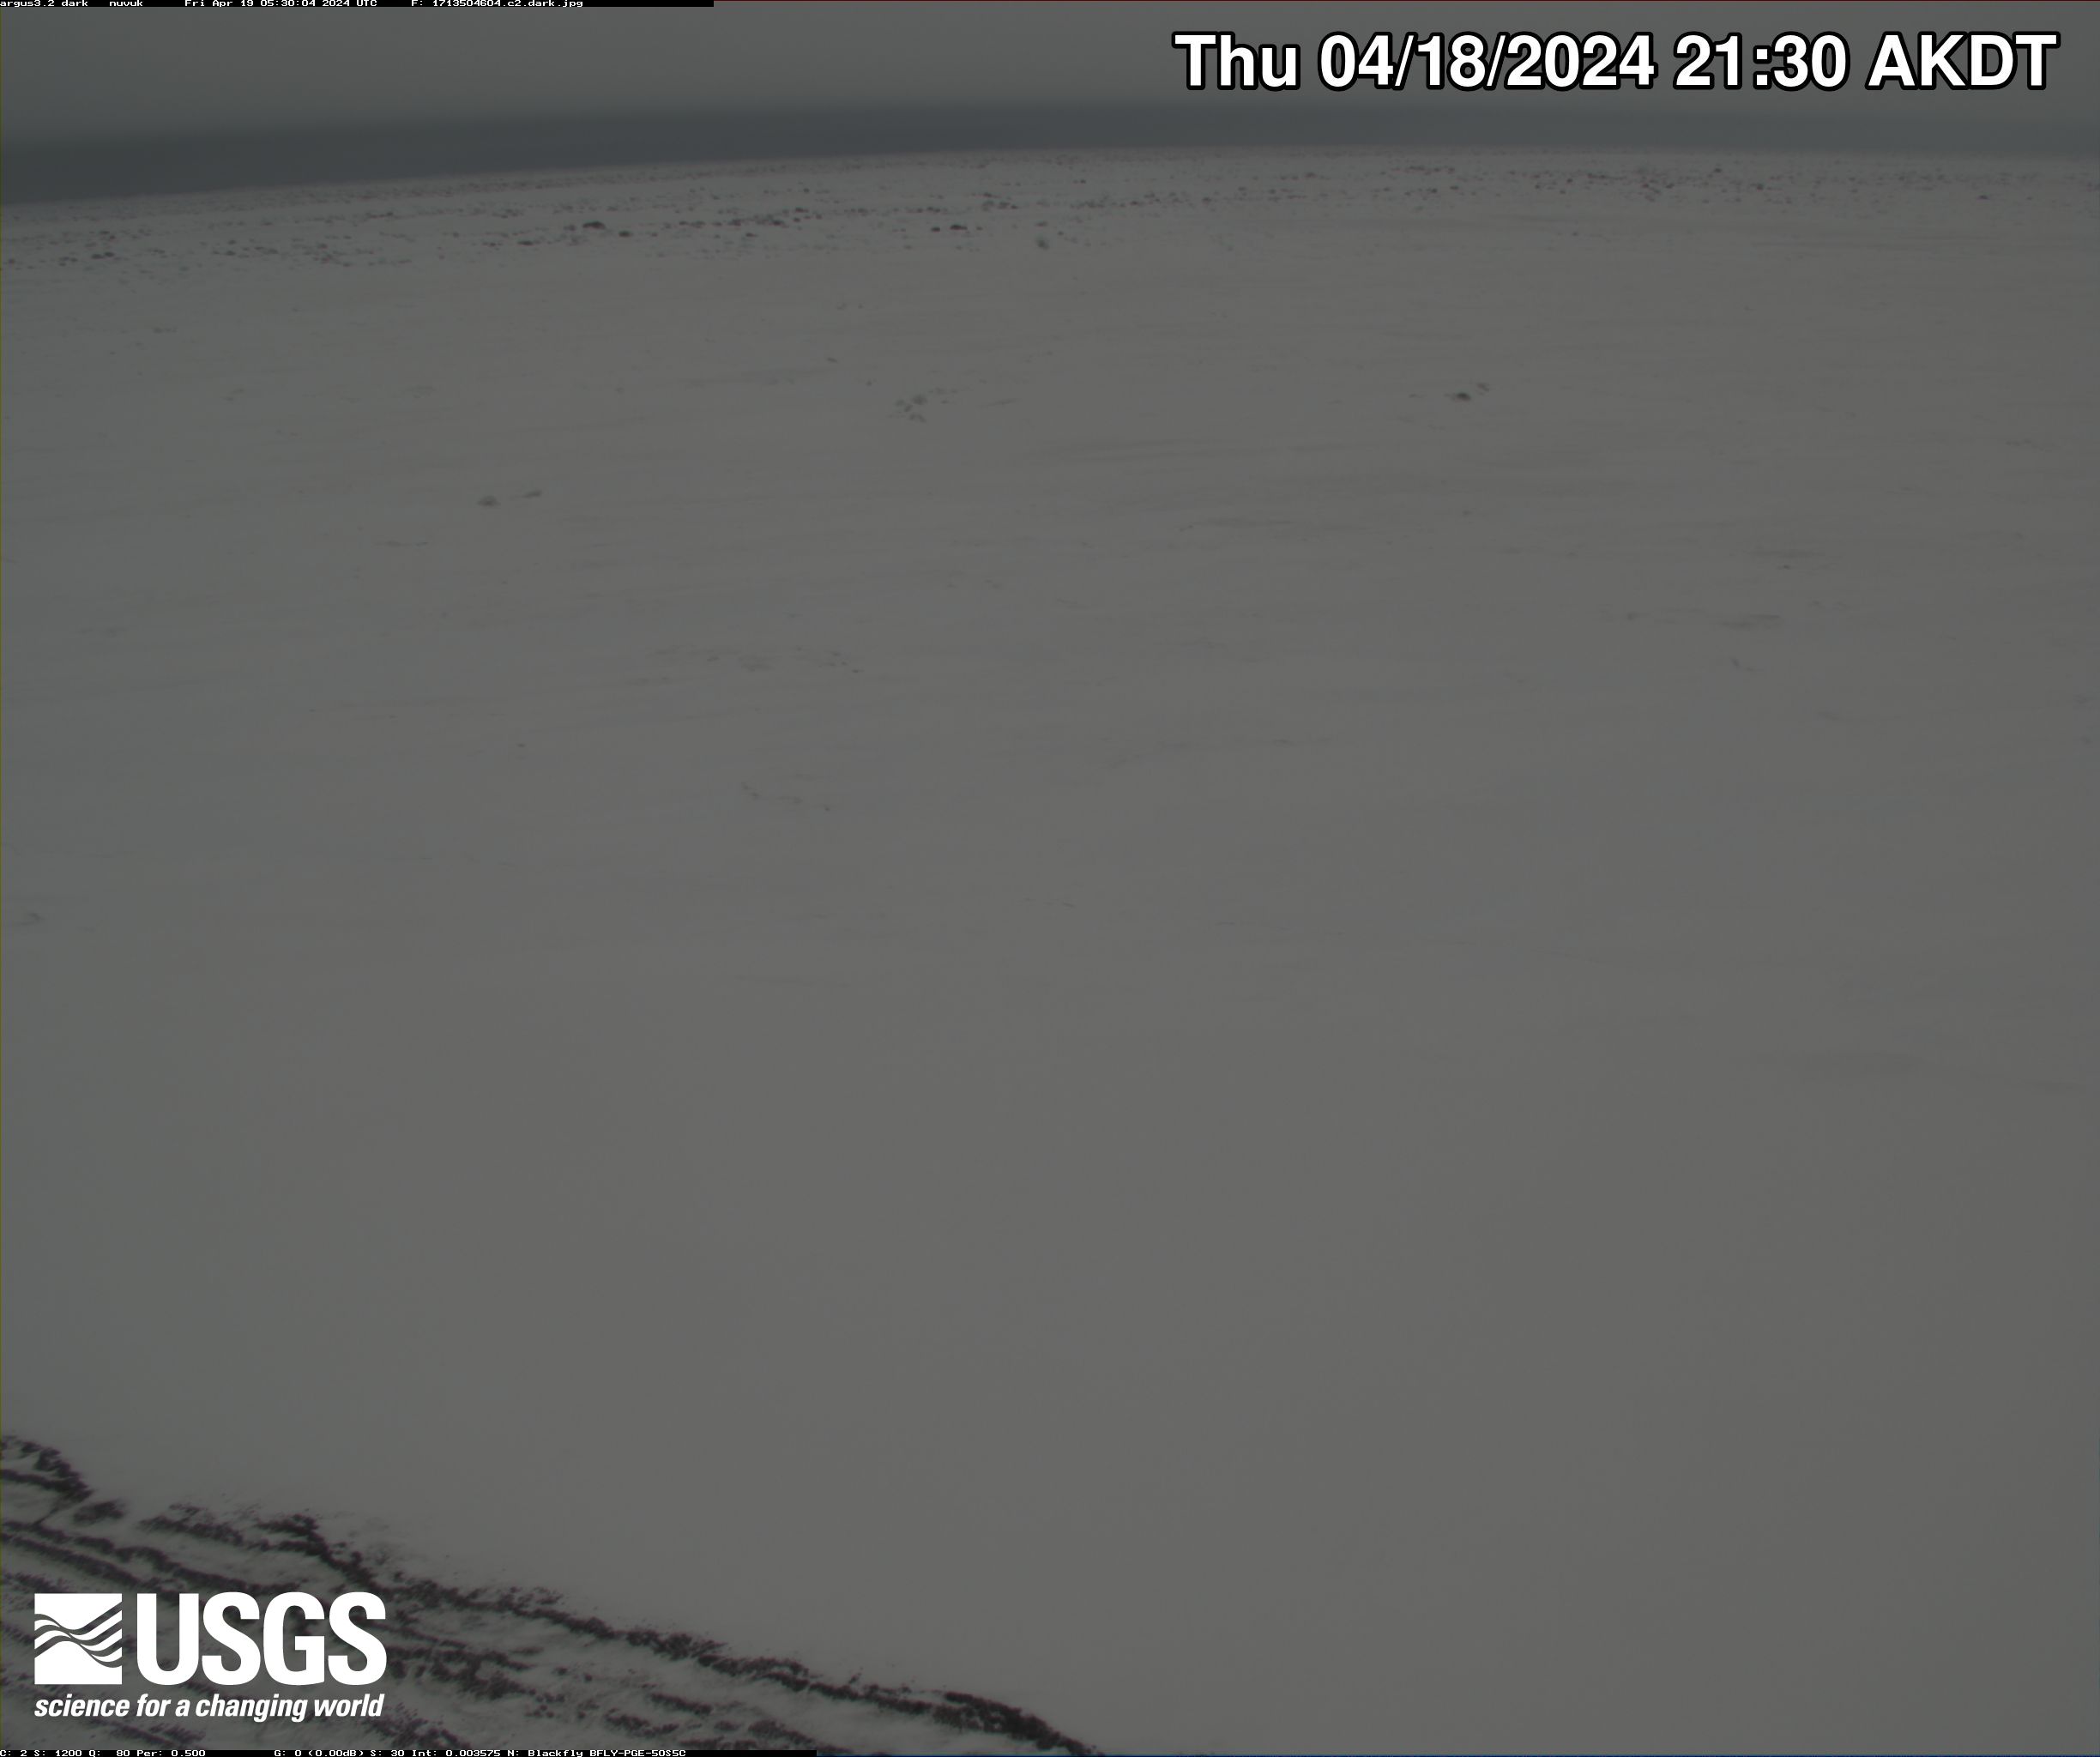
View of an Arctic beach area with gentle waters.
Nuvuk video camera 2 dark image

Two video cameras are installed atop a utility pole near the northernmost point of land in the United States at Nuvuk (Point Barrow), Alaska. The cameras point northwest toward the Arctic Ocean and the boundary between the Chukchi and Beaufort Seas. Every half hour during daylight hours, the cameras collect snapshots and video for 10 minutes.

Two video cameras are installed atop a utility pole near the northernmost point of land in the United States at Nuvuk (Point Barrow), Alaska. The cameras point northwest toward the Arctic Ocean and the boundary between the Chukchi and Beaufort Seas. Every half hour during daylight hours, the cameras collect snapshots and video for 10 minutes.

View of an Arctic beach area with gentle waters.
Nuvuk video camera 2 bright image

Two video cameras are installed atop a utility pole near the northernmost point of land in the United States at Nuvuk (Point Barrow), Alaska. The cameras point northwest toward the Arctic Ocean and the boundary between the Chukchi and Beaufort Seas. Every half hour during daylight hours, the cameras collect snapshots and video for 10 minutes.

Two video cameras are installed atop a utility pole near the northernmost point of land in the United States at Nuvuk (Point Barrow), Alaska. The cameras point northwest toward the Arctic Ocean and the boundary between the Chukchi and Beaufort Seas. Every half hour during daylight hours, the cameras collect snapshots and video for 10 minutes.

View of an Arctic beach area with gentle waters.
Nuvuk video camera 1 dark image

Two video cameras are installed atop a utility pole near the northernmost point of land in the United States at Nuvuk (Point Barrow), Alaska. The cameras point northwest toward the Arctic Ocean and the boundary between the Chukchi and Beaufort Seas. Every half hour during daylight hours, the cameras collect snapshots and video for 10 minutes.

Two video cameras are installed atop a utility pole near the northernmost point of land in the United States at Nuvuk (Point Barrow), Alaska. The cameras point northwest toward the Arctic Ocean and the boundary between the Chukchi and Beaufort Seas. Every half hour during daylight hours, the cameras collect snapshots and video for 10 minutes.

Was this page helpful?