
USGS Hawaiian Volcano Observatory geologist Mike Cappos takes the bearing of a crack that formed in Chain of Craters Road during a recent intrusive event near Pauahi Crater in Hawai‘i Volcanoes National Park. USGS photo by C. Sealing.
Images
Hawaiian Volcano Observatory images of eruptive activity, field work, and more.
Filter Total Items: 2971

August 22, 2024 — Measuring cracks on Chain of Craters Road, Kīlauea
USGS Hawaiian Volcano Observatory geologist Mike Cappos takes the bearing of a crack that formed in Chain of Craters Road during a recent intrusive event near Pauahi Crater in Hawai‘i Volcanoes National Park. USGS photo by C. Sealing.

August 22, 2024 — Measuring cracks on Chain of Craters Road, Kīlauea
USGS Hawaiian Volcano Observatory geologist Mike Cappos measures cracks that formed in Chain of Craters Road during a recent intrusive event near PAUAHI Crater in Hawai‘i Volcanoes National Park. USGS photo by C. Sealing.
USGS Hawaiian Volcano Observatory geologist Mike Cappos measures cracks that formed in Chain of Craters Road during a recent intrusive event near PAUAHI Crater in Hawai‘i Volcanoes National Park. USGS photo by C. Sealing.

August 22, 2024—InSAR image of ground deformation and map of seismicity for Kīlauea upper East Rift Zone intrusion
linkThe map on the left shows recent deformation at Kīlauea over the timeframe of August 9–21, 2024. Data were acquired by the European Space Agency's Sentinel-1A satellite. Colored fringes denote areas of ground deformation, with more fringes indicating more deformation. Each color cycle represents 2.8 cm (1.1 in) of ground motion.

August 20, 2024 — Routine field visit to Kīlauea summit
USGS scientists made a routine visit to the summit of Kīlauea for maintenance work on a webcam and general observations. The weather offered clear views of Kaluapele (the summit caldera), and only minor outgassing from several spots on the caldera floor. USGS photo by M. Patrick.
USGS scientists made a routine visit to the summit of Kīlauea for maintenance work on a webcam and general observations. The weather offered clear views of Kaluapele (the summit caldera), and only minor outgassing from several spots on the caldera floor. USGS photo by M. Patrick.

August 20, 2024 — Routine field visit to Kīlauea summit
USGS scientists visited the KWcam webcam, at the summit of Kīlauea, to replace the desiccant packs that keep the webcam enclosure dry. Despite ongoing earthquake activity in the upper East Rift Zone of Kīlauea, activity beneath the summit caldera was quiet today. USGS photo by M. Patrick.
USGS scientists visited the KWcam webcam, at the summit of Kīlauea, to replace the desiccant packs that keep the webcam enclosure dry. Despite ongoing earthquake activity in the upper East Rift Zone of Kīlauea, activity beneath the summit caldera was quiet today. USGS photo by M. Patrick.

August 19, 2024—InSAR image of Kīlauea ground deformation
This map shows recent deformation at Kīlauea, over the timeframe of August 7-19, 2024. Data were acquired by the European Space Agency's Sentinel-1A satellite. Colored fringes denote areas of ground deformation, with more fringes indicating more deformation. Each color cycle represents 2.8 cm (1.1 in) of ground motion.
This map shows recent deformation at Kīlauea, over the timeframe of August 7-19, 2024. Data were acquired by the European Space Agency's Sentinel-1A satellite. Colored fringes denote areas of ground deformation, with more fringes indicating more deformation. Each color cycle represents 2.8 cm (1.1 in) of ground motion.

Kīlauea middle East Rift Zone reference map
This reference map depicts the features on Kīlauea's middle East Rift Zone, much of which is within Hawaiʻi Volcanoes National Park. Pit craters and lava flows are evidence of a long history of magma moving along this rift zone pathway. Numerous eruptions took place in this region during the 1960s–1970s.
This reference map depicts the features on Kīlauea's middle East Rift Zone, much of which is within Hawaiʻi Volcanoes National Park. Pit craters and lava flows are evidence of a long history of magma moving along this rift zone pathway. Numerous eruptions took place in this region during the 1960s–1970s.

August 7, 2024—InSAR image of Kīlauea ground deformation
This map shows recent deformation at Kīlauea, over the timeframe of July 26-August 7, 2024. Data were acquired by the European Space Agency's Sentinel-1A satellite. Colored fringes denote areas of ground deformation, with more fringes indicating more deformation. Each color cycle represents 2.8 cm (1.1 in) of ground motion.
This map shows recent deformation at Kīlauea, over the timeframe of July 26-August 7, 2024. Data were acquired by the European Space Agency's Sentinel-1A satellite. Colored fringes denote areas of ground deformation, with more fringes indicating more deformation. Each color cycle represents 2.8 cm (1.1 in) of ground motion.

August 2, 2024—Sulfur Cone gas monitoring maintenance
On August 2,2024, Hawaiian Volcano Observatory Gas Scientists flew via helicopter to the Sulfur Cone Multi-Gas instrumentation site on Mauna Loa's Southwest Rift Zone, which is at an elevation of 3,430 meters (11,240 feet) above sea level.
On August 2,2024, Hawaiian Volcano Observatory Gas Scientists flew via helicopter to the Sulfur Cone Multi-Gas instrumentation site on Mauna Loa's Southwest Rift Zone, which is at an elevation of 3,430 meters (11,240 feet) above sea level.

August 2, 2024—Sulfur Cone gas monitoring maintenance
This photograph shows the inside of the Hawaiian Volcano Observatory (HVO) Multi-Gas site at Sulfur Cone. Currently, HVO has 2 of these continuous gas monitoring sites in operation on the Island of Hawai‘i. This one at Sulfur Cone high on Mauna Loa's Southwest Rift Zone, along with one at the summit of Kīlauea.
This photograph shows the inside of the Hawaiian Volcano Observatory (HVO) Multi-Gas site at Sulfur Cone. Currently, HVO has 2 of these continuous gas monitoring sites in operation on the Island of Hawai‘i. This one at Sulfur Cone high on Mauna Loa's Southwest Rift Zone, along with one at the summit of Kīlauea.

August 2, 2024—Sulfur Cone gas monitoring maintenance
The continuously monitoring Multi-Gas instrument at Sulfur Cone is housed inside the black Pelican case shown here. Air is pulled into the instrument via a small pump to be analyzed for volcanic gases (Sulfur Dioxide, Hydrogen Sulfide, Carbon Dioxide and Water Vapor).
The continuously monitoring Multi-Gas instrument at Sulfur Cone is housed inside the black Pelican case shown here. Air is pulled into the instrument via a small pump to be analyzed for volcanic gases (Sulfur Dioxide, Hydrogen Sulfide, Carbon Dioxide and Water Vapor).

August 2, 2024—Sulfur Cone gas monitoring maintenance
A Hawaiian Volcano Observatory gas scientist works to install a newly calibrated Multi-Gas instrument at the Sulfur Cone site. At an elevation of 3,430 meters (11,240 feet) above sea level, the air is rare! Working conditions are far more strenuous for HVO field teams at these high elevations due to the much lower levels of oxygen in the air to breathe.
A Hawaiian Volcano Observatory gas scientist works to install a newly calibrated Multi-Gas instrument at the Sulfur Cone site. At an elevation of 3,430 meters (11,240 feet) above sea level, the air is rare! Working conditions are far more strenuous for HVO field teams at these high elevations due to the much lower levels of oxygen in the air to breathe.

August 2, 2024—Sulfur Cone gas monitoring maintenance
This photo shows the gas monitoring site layout at Sulfur Cone. On the left side of the photo is the power/telemetry system which powers the Multi-Gas instrument and sends data back to HVO via radio to be later analyzed by HVO gas scientists.
This photo shows the gas monitoring site layout at Sulfur Cone. On the left side of the photo is the power/telemetry system which powers the Multi-Gas instrument and sends data back to HVO via radio to be later analyzed by HVO gas scientists.

August 2, 2024—Sulfur Cone gas monitoring maintenance
A Hawaiian Volcano Observatory gas scientist works on installing a newly calibrated Multi-Gas instrument at the Sulfur Cone gas monitoring site high up on Mauna Loa's Southwest Rift Zone at an elevation of 3,430 meters (11,240 feet) above sea level. USGS photo by M. Cappos.
A Hawaiian Volcano Observatory gas scientist works on installing a newly calibrated Multi-Gas instrument at the Sulfur Cone gas monitoring site high up on Mauna Loa's Southwest Rift Zone at an elevation of 3,430 meters (11,240 feet) above sea level. USGS photo by M. Cappos.
2024 HVO PIPES intern Kamalani Poepoe
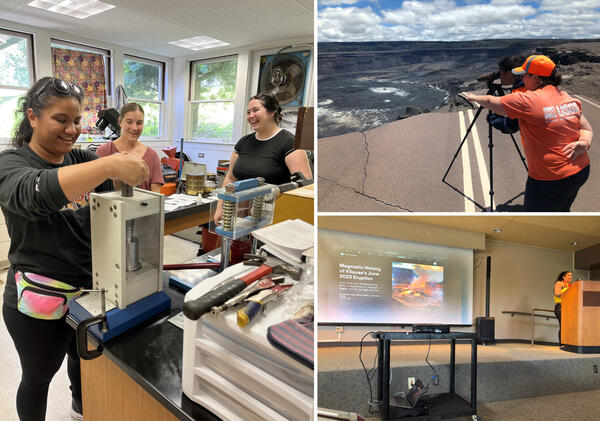
Left: 2024 HVO PIPES intern Kamalani Poepoe and colleagues prepare samples from Kīlauea’s June 2024 eruption for analysis. Top Right: Kamalani gets instruction on how to perform eruption response tasks on the rim of Halemaʻumaʻu. Lower Right: Kamalani presenting her work at the 2024 PIPES symposium in Honolulu, HI.
Left: 2024 HVO PIPES intern Kamalani Poepoe and colleagues prepare samples from Kīlauea’s June 2024 eruption for analysis. Top Right: Kamalani gets instruction on how to perform eruption response tasks on the rim of Halemaʻumaʻu. Lower Right: Kamalani presenting her work at the 2024 PIPES symposium in Honolulu, HI.

Example waveforms of HVO seismic data
Figure caption: Example waveforms showing a T-phase arriving from the M7.4 Chile earthquake on July 19, 2024 (left). This T-phase event is compared to a local tremor burst deep beneath Pāhala on July 30, 2024 (right). The plots show time for several stations in the HVO network. The T-phase moves more slowly across the network which is represented b
Figure caption: Example waveforms showing a T-phase arriving from the M7.4 Chile earthquake on July 19, 2024 (left). This T-phase event is compared to a local tremor burst deep beneath Pāhala on July 30, 2024 (right). The plots show time for several stations in the HVO network. The T-phase moves more slowly across the network which is represented b

Map of volcanoes and infrastructure on the Island of Hawaiʻi
Map of Island of Hawaiʻi, highlighting the four active or potentially active volcanoes of the Island, the number of people living on each volcano based on 2020 census data, major roads (transportation corridors) and minor roads (proxy for population density), when each volcano last erupted, and each volcano’s national threat assessment designation.
Map of Island of Hawaiʻi, highlighting the four active or potentially active volcanoes of the Island, the number of people living on each volcano based on 2020 census data, major roads (transportation corridors) and minor roads (proxy for population density), when each volcano last erupted, and each volcano’s national threat assessment designation.

July 25, 2024—Kīlauea upper East Rift Zone unrest
This reference map depicts recent unrest along Kīlauea's upper East Rift Zone. Earthquakes that occurred between July 22–25, 2024, are shown as yellow circles. Recent ground deformation in this region, over the timeframe of July 15-24, 2024, is shown as colored fringes; data were recorded by the Italian Space Agency's (ASI) Cosmo-SkyMED satellite.
This reference map depicts recent unrest along Kīlauea's upper East Rift Zone. Earthquakes that occurred between July 22–25, 2024, are shown as yellow circles. Recent ground deformation in this region, over the timeframe of July 15-24, 2024, is shown as colored fringes; data were recorded by the Italian Space Agency's (ASI) Cosmo-SkyMED satellite.

July 25, 2024 — Crack growth on Chain of Craters Road
On July 25, USGS-Hawaiian Volcano Observatory (HVO) staff again drove down the closed portion of Chain of Craters Road in Hawaiʻi Volcanoes National Park to check for any damage related to the July 22-25 intrusion on Kīlauea's upper East Rift Zone. They found many new small cracks in Chain of Craters Road, including this one, near Hiʻiaka Crater.
On July 25, USGS-Hawaiian Volcano Observatory (HVO) staff again drove down the closed portion of Chain of Craters Road in Hawaiʻi Volcanoes National Park to check for any damage related to the July 22-25 intrusion on Kīlauea's upper East Rift Zone. They found many new small cracks in Chain of Craters Road, including this one, near Hiʻiaka Crater.

July 24, 2024—InSAR image of Kīlauea ground deformation
This map shows recent deformation at Kīlauea, over the timeframe of July 15-24, 2024. Data were recorded by the Italian Space Agency's (ASI) Cosmo-SkyMED satellite. Colored fringes denote areas of ground deformation, with more fringes indicating more deformation. Each color cycle represents 1.5 cm (0.6 in) of ground motion.
This map shows recent deformation at Kīlauea, over the timeframe of July 15-24, 2024. Data were recorded by the Italian Space Agency's (ASI) Cosmo-SkyMED satellite. Colored fringes denote areas of ground deformation, with more fringes indicating more deformation. Each color cycle represents 1.5 cm (0.6 in) of ground motion.