



USGS Staff running levels-Green River at Spottsville, KY.
Images
Explore our planet through photography and imagery, including climate change and water all the way back to the 1800s when the USGS was surveying the country by horse and buggy.
Filter Total Items: 21394

Running levels-Green River at Spottsville, KY
USGS Staff running levels-Green River at Spottsville, KY.

USGS gage 05051522, Red River of The North at Hickson, ND
USGS gage 05051522, Red River of The North at Hickson, NDUSGS gage number 05051522, Red River of The North at Hickson, ND. This gage is managed by the Dakota Water Science Center.
USGS gage 05051522, Red River of The North at Hickson, ND
USGS gage 05051522, Red River of The North at Hickson, NDUSGS gage number 05051522, Red River of The North at Hickson, ND. This gage is managed by the Dakota Water Science Center.

USGS gage 05079000 Red Lake River at Crookston, MN
USGS gage 05079000 Red Lake River at Crookston, MNUSGS gage 05079000 Red Lake River at Crookston, MN manged by Dakota Water Science Center.
USGS gage 05079000 Red Lake River at Crookston, MN
USGS gage 05079000 Red Lake River at Crookston, MNUSGS gage 05079000 Red Lake River at Crookston, MN manged by Dakota Water Science Center.

USGS gage number 02310678 Homosassa Springs at Homosassa Springs, FL
USGS gage number 02310678 Homosassa Springs at Homosassa Springs, FLUSGS gage number 02310678 Homosassa Springs at Homosassa Springs, FL
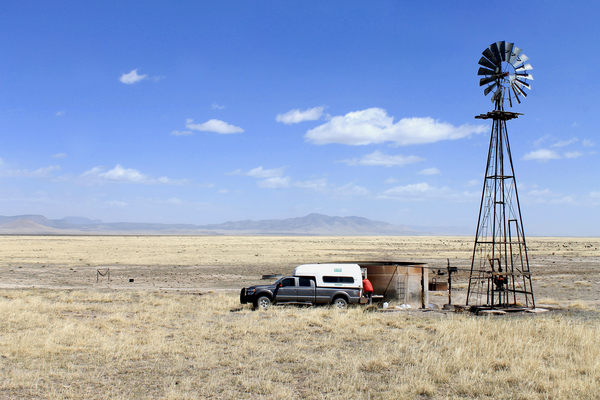
Water quality sampling in the western Plains of San Agustin
Water quality sampling in the western Plains of San AgustinUSGS scientist Mike Carlson works to collect a water quality sample from a windmill in the western Plains of San Agustin. Photo taken by Jeff Pepin on April 10th, 2019.
Water quality sampling in the western Plains of San Agustin
Water quality sampling in the western Plains of San AgustinUSGS scientist Mike Carlson works to collect a water quality sample from a windmill in the western Plains of San Agustin. Photo taken by Jeff Pepin on April 10th, 2019.

A close-up of the active fumarole field on the north wall of the pit.
A close-up of the active fumarole field on the north wall of the pit.A close-up of the active fumarole field on the north wall of the pit.
A close-up of the active fumarole field on the north wall of the pit.
A close-up of the active fumarole field on the north wall of the pit.A close-up of the active fumarole field on the north wall of the pit.

Thermal map of Kīlauea Caldera
Thermal map of Kīlauea Caldera
By
Thermal map of Kīlauea Caldera
By

Measuring flooding in downtown Fargo, ND
USGS hydrologist Dan Thomas prepares to measure record flows on the Red River of the North in downtown Fargo, North Dakota. The orange instrument is an acoustic Doppler current profiler, which is used to measure streamflow as it's pulled across the water.
USGS hydrologist Dan Thomas prepares to measure record flows on the Red River of the North in downtown Fargo, North Dakota. The orange instrument is an acoustic Doppler current profiler, which is used to measure streamflow as it's pulled across the water.

Measuring floodwater in Fargo, ND
A USGS crew measures flooding on the Red River in downtown Fargo, North Dakota. The orange instrument is an acoustic Doppler current profiler, which is used to measure streamflow as it's pulled across the water.
A USGS crew measures flooding on the Red River in downtown Fargo, North Dakota. The orange instrument is an acoustic Doppler current profiler, which is used to measure streamflow as it's pulled across the water.

Measuring high flows in Fargo, ND
An instrument called an acoustic Doppler current profiler (ADCP) takes streamflow measurements during flooding. The ADCP is attached to a buoy that is dragged in the water either alongside a boat or by hand. USGS hydrologist Dan Thomas points to the ADCP sensor on the Red River of the North during flooding in downtown Fargo, ND.
An instrument called an acoustic Doppler current profiler (ADCP) takes streamflow measurements during flooding. The ADCP is attached to a buoy that is dragged in the water either alongside a boat or by hand. USGS hydrologist Dan Thomas points to the ADCP sensor on the Red River of the North during flooding in downtown Fargo, ND.

Adjusting camera settings during an aerial survey
Biological Technician Laura (Laney) White adjusts camera settings during a survey.
The Seabird Studies Team at the USGS Western Ecological Research Center is conducting aerial photographic surveys of the ocean off central and southern California to create comprehensive maps of seabird and marine mammal distributions.
Biological Technician Laura (Laney) White adjusts camera settings during a survey.
The Seabird Studies Team at the USGS Western Ecological Research Center is conducting aerial photographic surveys of the ocean off central and southern California to create comprehensive maps of seabird and marine mammal distributions.

Measuring flooding on the Maple River, ND
A USGS crew measures high flow during flooding on the Maple River near Mapleton, North Dakota. The yellow instrument is an acoustic Doppler current profiler, which is used to measure streamflow as it's pulled across the water. The crew is standing on a road that had been overtaken by the river.
A USGS crew measures high flow during flooding on the Maple River near Mapleton, North Dakota. The yellow instrument is an acoustic Doppler current profiler, which is used to measure streamflow as it's pulled across the water. The crew is standing on a road that had been overtaken by the river.

Measuring high flows, Maple River, ND
A USGS crew measures high flow during flooding on the Maple River near Mapleton, North Dakota. The instrument being pulled across the water is an acoustic Doppler current profiler, which is used to measure streamflow. The truck is parked on a road that had been overtaken by the river.
A USGS crew measures high flow during flooding on the Maple River near Mapleton, North Dakota. The instrument being pulled across the water is an acoustic Doppler current profiler, which is used to measure streamflow. The truck is parked on a road that had been overtaken by the river.

Measuring high water flow on the Maple River, ND
This is not a lake! A USGS crew measures high flow during flooding on the Maple River near Mapleton, North Dakota. The instrument being pulled across the water is an acoustic Doppler current profiler (ADCP), which is used to measure streamflow.
This is not a lake! A USGS crew measures high flow during flooding on the Maple River near Mapleton, North Dakota. The instrument being pulled across the water is an acoustic Doppler current profiler (ADCP), which is used to measure streamflow.

Spring 2019 Flooding - Red River of the North in North Dakota
Spring 2019 Flooding - Red River of the North in North DakotaTwo USGS technicians observe water measurements from a boat with flooding in the background during record Midwest flooding in spring 2019.
Spring 2019 Flooding - Red River of the North in North Dakota
Spring 2019 Flooding - Red River of the North in North DakotaTwo USGS technicians observe water measurements from a boat with flooding in the background during record Midwest flooding in spring 2019.

Spring 2019 Flooding - Red River of the North in North Dakota
Spring 2019 Flooding - Red River of the North in North DakotaA USGS technician steers a watercraft with floodwaters in the background during record Midwest flooding in spring 2019.
Spring 2019 Flooding - Red River of the North in North Dakota
Spring 2019 Flooding - Red River of the North in North DakotaA USGS technician steers a watercraft with floodwaters in the background during record Midwest flooding in spring 2019.

Taking streamflow measurements during flooding in ND
Taking streamflow measurements during flooding in NDA USGS crew prepares to measure streamflow during record flooding on the Maple River near Mapleton, ND, on April 6, 2019. The instrument pictured is an acoustic Doppler current profiler which measures streamflow as it's dragged across the water.
Taking streamflow measurements during flooding in ND
Taking streamflow measurements during flooding in NDA USGS crew prepares to measure streamflow during record flooding on the Maple River near Mapleton, ND, on April 6, 2019. The instrument pictured is an acoustic Doppler current profiler which measures streamflow as it's dragged across the water.

Taking streamflow measurements in ND
A USGS crew measures streamflow during record flooding on the Red River of the North near Georgetown, ND, on April 6, 2019. The apparatus in the middle of the image is a USGS temporary streamgage installed to monitor flooding, and the orange instrument pictured is an acoustic Doppler current profiler that measures streamflow.
A USGS crew measures streamflow during record flooding on the Red River of the North near Georgetown, ND, on April 6, 2019. The apparatus in the middle of the image is a USGS temporary streamgage installed to monitor flooding, and the orange instrument pictured is an acoustic Doppler current profiler that measures streamflow.

Up in the air for aerial photographic surveys
Pilot Barry expertly flies the plane at the correct survey speed and altitude to obtain crisp, clear images.
The Seabird Studies Team at the USGS Western Ecological Research Center is conducting aerial photographic surveys of the ocean off central and southern California to create comprehensive maps of seabird and marine mammal distributions.
Pilot Barry expertly flies the plane at the correct survey speed and altitude to obtain crisp, clear images.
The Seabird Studies Team at the USGS Western Ecological Research Center is conducting aerial photographic surveys of the ocean off central and southern California to create comprehensive maps of seabird and marine mammal distributions.

View of the ocean and coast from above
View of the ocean off the central California coast at the start of a flight.
The Seabird Studies Team at the USGS Western Ecological Research Center is conducting aerial photographic surveys of the ocean off central and southern California to create comprehensive maps of seabird and marine mammal distributions.
View of the ocean off the central California coast at the start of a flight.
The Seabird Studies Team at the USGS Western Ecological Research Center is conducting aerial photographic surveys of the ocean off central and southern California to create comprehensive maps of seabird and marine mammal distributions.

Viewing data during an aerial photographic survey
Biological Technician Amelia DuVall views data in real time during an aerial photographic survey.
Biological Technician Amelia DuVall views data in real time during an aerial photographic survey.