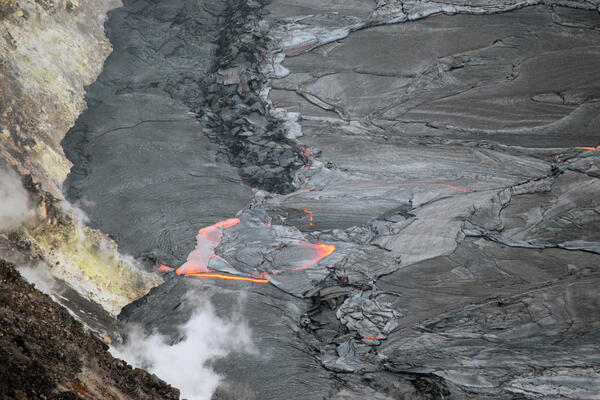
Multimedia Gallery
Images Carousel
Images
Explore our planet through photography and imagery, including climate change and water all the way back to the 1800s when the USGS was surveying the country by horse and buggy.
fissure 7 of Kīlauea's 2018 lower East Rift Zone eruption
On September 3, USGS HVO geologists visited fissure 7 of Kīlauea's 2018 lower East Rift Zone eruption. Geologists investigated and documented vent features, and collected samples for ongoing analyses of 2018 eruption dynamics. Fountains from fissure 7 left a hole over the vent area. From this hole, one of several fissure 7 fountains erupted during the 2018 volcanic crisis
...Birch Creek near Valier streamgage
Birch Creek near Valier streamgage
Underneath Kīlauea’s new landscape, the magma plumbing keeps working
View of the 2018 Kīlauea caldera collapse structures from Kīlauea Overlook within Hawai‘i Volcanoes National Park. USGS photo by K. Mulliken on Sept. 2, 2020.
Thin section of lava sample from Yellowstone
Thin section made by slicing a small layer off the surface of a hand sample of Yeloowstone lava. Note the marker for scale.
Total Water Level and Coastal Change Forecast Expansion, 2020
The Total Water Level and Coastal Change Forecast has continually expanded since real-time forecasts began in 2015. In 2020, new regions of the Gulf and South Atlantic coasts were added to the forecast and officially approved for use in National Weather Service Forecasts. The Total Water Levels and Coastal Change (TWL-CC) Forecast Viewer is a web-based tool that visualizes
...Nontidal network mapper
The nontidal network mapper is a story map that provides the primary findings for nitrogen, phosphorus and suspended-sediment trends, and gives the user tools to further examine the results for river basins and individual sites. Data used in the mapper, and the methods used to compute trends and loads, can also be accessed from the tool.
Data collected from the 123
...August 2020 Active Groundwater Level Network Animation
The USGS Active Groundwater Level Network includes about 20,000 wells that have been measured by the USGS or USGS cooperators at least once within the past 13 months. The animation shows a daily snapshot of water-level statistics in the network for August 2020
...Lesley DeFalco works on post-fire plant surveys in Nevada
Research scientist Lesley DeFalco works on native and invasive annual plant sampling at the site of the Tramp Fire,one of 12 fires for which the USGS and the BLM are implementing landscape scale restoration treatments.
I Am A...Herpetologist Coloring Page
Geodesy through time: a history of measuring the shape of Hawaiian volcanoes
Hawaiian Volcano Observatory (HVO) Global Positioning System (GPS) survey near the coast in Hawai‘i Volcanoes National Park on September 10, 2019 (USGS photo by P. Dotray).
Vermillion River near Vermillion OH - frozen waterfall
Giantess Geyser in eruption on August 26, 2020
Giantess Geyser in eruption at approximately 10:00 AM MDT on August 26, 2020. Old Faithful is erupting in the center background.
Example of a boundary problem in the Yellowstone geologic map
An example of a boundary iproblem n the Yellowstone National Park geologic map, which was stitched together from many smaller mapped sections. The red line highlights the contacts that contain different units across the boundary.
Coastal Change Hazards Portal for Hurricane Laura
This Coastal Change Storm Hazard Team forecast was made at 4 AM CDT August 26, 2020 and shows forecast beach erosion at the base of the dunes (the strip of colored bars closest to the coast), overwash (middle strip) and inundation (outer strip) from Hurricane Laura. The model accounts for sandy beaches and barrier islands and does not include marshes, forested or sea
...Whippany Morristown Webcam
Image from the Whippany River at Morristown webcam
Streamgage Installation
Installation of USGS streamflow gaging station 06098120 Birch Creek at Bullhead Bridge near Valier, MT.
The colorful caldera lake at Kīlauea summit
The colorful caldera lake at Kīlauea summit. The view is from the western rim of Halema‘uma‘u crater, 1900 ft (580 m) above the water surface, in a restricted area of Hawai‘i Volcanoes National Park. USGS photo by M. Patrick 08/25/2020.
Measuring bathymetry of the Black River near Great Bend, NY
Devin Gaige and Amanda May measure bathymetry of the Black River near Great Bend, NY
USGS Director Jim Reilly gives a speech
The USGS Forest and Rangeland Ecosystem Science Center (FRESC) held a groundbreaking ceremony on August 25, 2020 at the Idaho Water Science Center (IDWSC) in Boise, Idaho. FRESC is moving their Snake River Field Station, presently located on the Boise State University campus, to the IDWSC campus and building a new facility for the USGS Pacific Northwest environmental DNA
...Photomicrographs from a desert cottontail found dead in Texas
Photomicrographs from a desert cottontail found dead in Texas, U.S.A. showing (A) panlobular hepatocellular dissociation and necrosis and (B) intra-alveolar edema fluid (asterisk) and foamy pulmonary macrophages (arrows) in the lung.
Thick-billed Murres on the Pribilof Islands
Pelagic cormorant, Gull Island, Kachemak Bay Alaska
Fountain Creek near Manitou Spring, Colorado
Image of a streamflow discharge measurement site on Fountain Creek near Manitou Springs, Colorado.
Tree rings in a Rocky Mountain Juniper, Yellowstone National Park
A scanned image of Rocky Mountain juniper deadwood sample GGR100 collected in the northern part of Yellowstone National Park under permit YELL-5582. The full length of this sample covers the time period 723-1792 CE. Since climate influences tree growth and the width of annual rings, the relation between ring widths and recent instrumental climate records (air temperature
...Lidar Explorer 8/21/2020
Lidar Explorer as of 8/21/2020
Doppler radar in Ka‘ū: more than a weather radar
Nā‘ālehu radome, 39 ft (about 12 m) in diameter. The radar dish inside is 28 ft (8.5 m) across. USGS photo by C. Neal on July 27, 2019. More details on the technical specifications of this instrument can be found at this website (https://www.roc.noaa.gov/WSR88D/Engineering/NEXRADTechInfo.aspx).
Doppler radar in Ka‘ū: more than a weather radar
Radar image of the May 17, 2018 eruption of ash from Halema‘uma‘u Crater. This image is a slice through the cloud at an altitude of 14,000 ft (4 km) above sea level at 4:12 a.m., HST. The colors scale is radar reflectivity, a measure of the size of the particles and their concentration within the ash cloud. Colors indicate the different echo intensities or reflectivity.
...Hillsdale Webcam
Webcam image from Pascack Brook at Woodcliff Lake outlet at Hillsdale, NJ (01377451)
Geiger mode lidar over Chicago, IL
Geiger mode 3DEP lidar point cloud over Chicago, IL from 3DEP Project USGS Lidar Point Cloud IL 4County Cook 2017
Example of the Landsat 7 ETM+ Collection 2 level-2 science products
Example of the Landsat 7 ETM+ Collection 2 level-2 science products. Left: Landsat 7 level-2 surface reflectance image. Right: Landsat 7 level-2 surface temperature image. The data was acquired on August 19, 2020 (path 179 row 28).
Photographs from organs of a mountain cottontail rabbit found dead
Photographs from an adult female mountain cottontail rabbit (Sylvilagus nuttallii) found dead in Montana, U.S.A. (A) Liver with random foci of necrosis (asterisk) characterized by accumulation of cellular detritus intermingled with fibrin and colonies of small coccoid bacteria (inset). H&E stain. (B) The spleen exhibits multifocal confluent areas of necrosis (
...Landsat 8 image showing Lakes Everard and Harry in S. Australia
Example of the Landsat 8 OLI/TIRS Collection 2 level-1 product. This Landsat 8 image was acquired on August 18, 2020 over Lake Everard and Lake Harry in southern Australia and is shown as a false color composite using the shortwave infrared, near infrared, and red bands (bands 6,5,4).
Deformation that results from pressurization of a "Mogi" source model
Cross section through the Earth showing the ground surface with an embedded pressure source (red circle)—the so-called “Mogi model”—beneath the ground. When this pressure source expands, the ground surface inflates like a balloon (the opposite occurs when the pressure in the source decreases). Dashed black line shows, in an exaggerated way, how the shape the surface
...Field Photo Friday August 2020- Scott George holding 2 crabs
Field Photo Friday August 2020 - Scott George holding 2 crabs
Digital elevation model of Laguna Creek, AZ
Digial elevation model of USGS site 365149109492300 Laguna Creek below Dennehotso near Kayenta, AZ.
Photo looking north from the north shore of Yellowstone Lake
Photo looking north from the north shore of Yellowstone Lake. The photo was taken from a level bench, or terrace, which marks a previous high stand of the lake. In the middle distance (between the two red lines), the ground slopes up to second, higher-level terrace that indicates an even higher past lake level.
Cascadia fieldwork map
Index map of U.S. Cascadia margin showing where data have been collected since 2018 as part of the Subduction Zone Marine Geohazards Project. Details of each survey effort are provided on the Cascadia Subduction Zone Marine Geohazards project web site.
Subduction zone schematic
Schematic cross-section of the accretionary wedge along the Cascadia subduction zone. Modified from Moore and others, 2007.
Cascadia megathrust fault map
Topo-bathymetric map of the Cascadia subduction zone. Cascadia megathrust fault (white line); approximate shelf break along 200-m isobath (yellow line); MTJ, Mendocino triple junction.
Bathymetric map of offshore Washington
Bathymetric map of offshore Washington reveals seafloor features and submarine canyons.
Bathymetric map of offshore Oregon
Bathymetric map of offshore Oregon with Stonewall, Heceta, and Siltcoos Banks labeled.
Offshore northern California bathymetric map
Bathymetric map of offshore northern California reveals seafloor features and submarine canyons.
01328770 Hudson River at Thompson, NY ADCP measurement
01328770 Hudson River at Thompson, Justin Rappold making an Acoustic Doppler Current Profiler (ADCP) discharge measurement.
Water was in Kīlauea caldera before the 2018 summit collapse
Black streak on caldera wall (center) is about 50 m (yards) long, and white steam plume (lower right) rises from northwestern part of Halema‘uma‘u. Photo from Volcano House Hotel on July 4, 2018. The configuration of this area changed considerably after the photo was taken, as collapse continued into early August. USGS photo.