Fissure eruption of lava fountains, Kīlauea Volcano’s East Rift Zone
Fissure eruption of lava fountains, Kīlauea Volcano’s East Rift ZoneFissure eruption of low lava fountains from Kīlauea Volcano’s East Rift Zone in 2007, Island of Hawaiʻi.

Official websites use .gov
A .gov website belongs to an official government organization in the United States.
Secure .gov websites use HTTPS
A lock () or https:// means you’ve safely connected to the .gov website. Share sensitive information only on official, secure websites.
Volcano Hazard Program images.

Fissure eruption of low lava fountains from Kīlauea Volcano’s East Rift Zone in 2007, Island of Hawaiʻi.
Fissure eruption of low lava fountains from Kīlauea Volcano’s East Rift Zone in 2007, Island of Hawaiʻi.

Aerial photo showing lava fountains and flows from one of the fissure segments on March 8. A channelized ‘A‘ā flow is hidden by fume to right. Distant fume shows locations of other earlier Kamoamoa fissures active March 5-7. Pu‘u ‘Ō‘ō about 3.6 km (2.2) in distance from the fountains.
Aerial photo showing lava fountains and flows from one of the fissure segments on March 8. A channelized ‘A‘ā flow is hidden by fume to right. Distant fume shows locations of other earlier Kamoamoa fissures active March 5-7. Pu‘u ‘Ō‘ō about 3.6 km (2.2) in distance from the fountains.

Aerial photo of the Kamoamoa eruption on March 7, 2011. The western fissure feeding a channelized ‘a‘ā flow is visible in the lower right, while the eastern end of the fissure system and Pu‘u‘ō‘ō crater are in the upper left. USGS photo by T. Orr.
Aerial photo of the Kamoamoa eruption on March 7, 2011. The western fissure feeding a channelized ‘a‘ā flow is visible in the lower right, while the eastern end of the fissure system and Pu‘u‘ō‘ō crater are in the upper left. USGS photo by T. Orr.

Image from a thermal camera located on the rim of Halema‘uma‘u crater above the Overlook vent and looking into the vent after the lava lake nearly drained away completely starting March 5. Volcanic tremor and summit deflation began at about 1:42 p.m. HST on March 5, and was shortly followed by draining of the lava lake.
Image from a thermal camera located on the rim of Halema‘uma‘u crater above the Overlook vent and looking into the vent after the lava lake nearly drained away completely starting March 5. Volcanic tremor and summit deflation began at about 1:42 p.m. HST on March 5, and was shortly followed by draining of the lava lake.

HVO gas geochemist uses a Fourier transform infrared (FTIR) spectrometer to measure volcanic gas compositions emitted during the 2011 Kamoamoa fissure eruption on the East Rift Zone of Kīlauea Volcano. The instrument measures the infrared energy from the hot lava fissure as it passes through, and is absorbed by, the volcanic plume along an open atmospheric path.
HVO gas geochemist uses a Fourier transform infrared (FTIR) spectrometer to measure volcanic gas compositions emitted during the 2011 Kamoamoa fissure eruption on the East Rift Zone of Kīlauea Volcano. The instrument measures the infrared energy from the hot lava fissure as it passes through, and is absorbed by, the volcanic plume along an open atmospheric path.

Hawaiian Volcano Observatory scientists map and measure ground cracks during the Kamoamoa eruption. USGS photo taken by N. Richter on March 6, 2011.
Hawaiian Volcano Observatory scientists map and measure ground cracks during the Kamoamoa eruption. USGS photo taken by N. Richter on March 6, 2011.

Scientists collect volcanic gas data using a Fourier Transform Infrared spectrometer (FTIR). During the Kamoamoa eruption, sulfur dioxide emission rates from Kīlauea’s East Rift Zone reached the highest levels since the episodes of high-fountaining at Pu‘u‘ō‘ō (1983–1986) with an average rate of 8,500 tonnes per day and a peak value of 11,000 tonnes per day.
Scientists collect volcanic gas data using a Fourier Transform Infrared spectrometer (FTIR). During the Kamoamoa eruption, sulfur dioxide emission rates from Kīlauea’s East Rift Zone reached the highest levels since the episodes of high-fountaining at Pu‘u‘ō‘ō (1983–1986) with an average rate of 8,500 tonnes per day and a peak value of 11,000 tonnes per day.

A geologist collects a molten lava sample from the Kamoamoa eruption. USGS photo taken by M. Patrick on March 6, 2011.
A geologist collects a molten lava sample from the Kamoamoa eruption. USGS photo taken by M. Patrick on March 6, 2011.

Lava spatters above the fissure just west of the base of Pu‘u ‘Ō‘ō on March 6, 2011.
Lava spatters above the fissure just west of the base of Pu‘u ‘Ō‘ō on March 6, 2011.

HVO geologist carries a freshly quenched lava sample from the 2011 Kamoamoa fissure eruption on Kīlauea Volcano. Molten lava is quickly placed in a bucket of water to "freeze" the growth of minerals for chemical and microscopic analyses.
HVO geologist carries a freshly quenched lava sample from the 2011 Kamoamoa fissure eruption on Kīlauea Volcano. Molten lava is quickly placed in a bucket of water to "freeze" the growth of minerals for chemical and microscopic analyses.

InSAR image Kīlauea, Hawai‘i, Mar. 2011. Kamoamoa fissure trace is indicated by the red line.
InSAR image Kīlauea, Hawai‘i, Mar. 2011. Kamoamoa fissure trace is indicated by the red line.

As lava entered the sea in July 2008, littoral explosions sent incandescent lava fragments skyward, building a small littoral cone on the flank of Kīlauea. USGS photo by B. Gaddis.
As lava entered the sea in July 2008, littoral explosions sent incandescent lava fragments skyward, building a small littoral cone on the flank of Kīlauea. USGS photo by B. Gaddis.

Village of Belacázar, adjacent to the river Paez. Photo taken four years after the 2008 lahar, but the trace of the deposit and destruction is still visible.
Village of Belacázar, adjacent to the river Paez. Photo taken four years after the 2008 lahar, but the trace of the deposit and destruction is still visible.

Since the opening of the Overlook vent in Halema‘uma‘u Crater in 2008, FTIR spectroscopy has been used to monitor summit eruptive-gas composition. Infrared energy emitted by the lava lake surface (top left) is absorbed by gases present in the path between the instrument and the lak surface.
Since the opening of the Overlook vent in Halema‘uma‘u Crater in 2008, FTIR spectroscopy has been used to monitor summit eruptive-gas composition. Infrared energy emitted by the lava lake surface (top left) is absorbed by gases present in the path between the instrument and the lak surface.

Thousands were saved by accurate eruption forecasts of Mount Merapi, Indonesia. House in the village of Kopeng, 6 km (3.7 miles) from summit of Mount Merapi, destroyed by the explosive eruption.
Thousands were saved by accurate eruption forecasts of Mount Merapi, Indonesia. House in the village of Kopeng, 6 km (3.7 miles) from summit of Mount Merapi, destroyed by the explosive eruption.

Blocky, non-vesicular ash particle indicative of water-magma interaction.
Blocky, non-vesicular ash particle indicative of water-magma interaction.

SEM Images of ash particles from the 1989 eruption of Redoubt Volcano, Alaska.
SEM Images of ash particles from the 1989 eruption of Redoubt Volcano, Alaska.

An HVO scientist wearing a gas mask collects GPS data using a roving instrument on the west flank of Pu‘u ‘Ō‘ō. USGS Photo.
An HVO scientist wearing a gas mask collects GPS data using a roving instrument on the west flank of Pu‘u ‘Ō‘ō. USGS Photo.

An HVO scientist and volunteer work to upgrade the power system of a seismic station located in the Ka‘ū desert on Kīlauea's southwest rift zone. USGS Photo.
An HVO scientist and volunteer work to upgrade the power system of a seismic station located in the Ka‘ū desert on Kīlauea's southwest rift zone. USGS Photo.
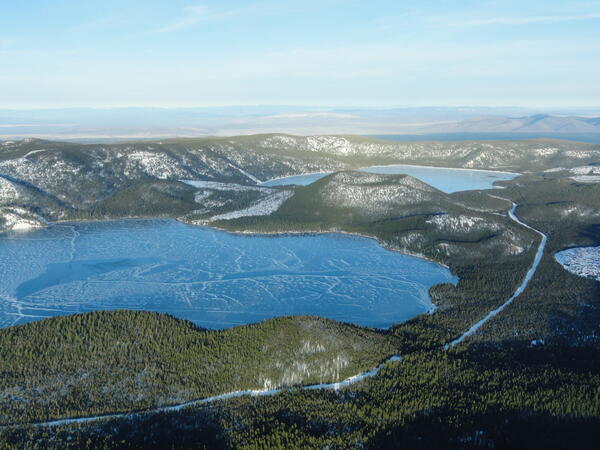
A view looking northeast across the central caldera of Newberry Volcano. Paulina Lake is in the foreground and East Lake is in the distance. The Central Pumice Cone lies between the two lakes. Near the bottom of the photo at the south edge of Paulina Lake, the two hills are named the Lakeshore Domes.
A view looking northeast across the central caldera of Newberry Volcano. Paulina Lake is in the foreground and East Lake is in the distance. The Central Pumice Cone lies between the two lakes. Near the bottom of the photo at the south edge of Paulina Lake, the two hills are named the Lakeshore Domes.

Gas sampling from a fumarole on the rim of Halema‘uma‘u Crater within Kīlauea caldera, Hawai‘i.
Gas sampling from a fumarole on the rim of Halema‘uma‘u Crater within Kīlauea caldera, Hawai‘i.