U.S. flag

An official website of the United States government

Multimedia documenting coastal change hazards research at the USGS

View from the sky looks down on a roadway that runs along a coastal cliff, part of the road has washed away.
The atmospheric river, a narrow, powerful track of water vapor that delivers tremendous volumes of rain, hit the central California coast and stalled there between January 26 and 28, 2021 — with catastrophic consequences. The area around Rat Creek, about 20 miles south of Big Sur's town center, received more than 8 inches of rain during a 2-day period, according to the National Weather Service. Rainwater washed dead trees, ash, mud, and rock downslope, a result of large areas of scorched land from the 2020 summer wildfire season. Drain pipes that run below Highway 1 were clogged with the debris and were eventually overwhelmed, causing the massive blow-out of Highway 1. On January 29th, a USGS reconnaissance flight snapped this dramatic photo above the Rat Creek drainage showing the debris flow. Such photos collected over time are precisely analyzed and used to make measurements of cliff movement. This information can help inform emergency managers of specific areas with the potential for future landslides and cliff collapse that threaten coastal communities.
North Carolina Coastline
A breach in the coastline of Rodanthe, North Carolina, caused by Hurricane Irene in 2011. Repeated storm impacts, combined with sea level rise, make the development and improvement of models that help forecast coastal change very important to planners working to build more resilient communities
Photo looking west along Fire Island, NY, showing the breach that developed during Hurricane Sandy
During Hurricane Sandy a breach developed along Fire Island, NY.
Time lapse GIF of a breach on Fire Island following Hurricane Sandy in 2012.
This GIF shows a time lapse before and after Hurricane Sandy caused a breach on Fire Island on October 29, 2012. The breach formed a new inlet that connected the Atlantic Ocean with the Great South Bay. The breach remains a relatively stable yet dynamic feature.
photo of USGS staffers on beach making bathymetric survey of Long Island barrier-island breach from Hurricane Sandy
USGS staffers on beach making bathymetric survey of Long Island barrier-island breach from Hurricane Sandy.
Surveying the Wildnerness Breach after Hurricane Sandy
The USGS, in collaboration with U.S Army Corps of Engineers, used an amphibious vehicle to survey the breach and adjacent coastline.
A series of three photographs showing a progression of erosion along a cliff area.
Image: Coastal Erosion in San Francisco
Winter storm erosion of coastal bluffs at Ocean Beach, San Francisco in 2010.
Photograph of bluff erosion in 2010 undermining the Great Highway at the southern end of Ocean Beach, San Francisco.
Bluff erosion during the 2009–10 El Niño undermined the Great Highway guardrail at the southern end of Ocean Beach, San Francisco, California. The shoreline eroded, on average, 55 meters that winter, leading to lane closures on the highway and an emergency $5-million revetment along the base of this bluff. Photo taken by Jeff Hansen, USGS, 20 January 2010.
Image: Severe Coastal Erosion During an El Niño Storm
Severe coastal bluff erosion, along the southern end of Ocean Beach, San Francisco, California. This storm damage occurred during the 2009-2010 El Niño, which, on average, eroded the shoreline 55 meters that winter.
Water splashes onto a cement waterfront walkway through chain link fencing.
Unusually high tides, sometimes called "king tides," offer a preview of coastal flooding likely to result from rising sea level. In this photograph, taken during a king tide on February 17, 2011, waves overtop Pier 14 in San Francisco, California.
Photograph shows eroding cliff in Isla Vista, California, with parts of houses hanging over edge.
Homes along the edge of the coast in Isla Vista, California, Santa Barbara County, face a short lifespan because of eroding bluffs that support them.
Three men stand on back porch of house in center background surrounded by debris, while water rushes past in foreground.
Residents in the northern part of the capital city of Majuro in the Marshall Islands watch as their neighborhood floods with seawater during a king tide. This high tide followed flooding from storm surge earlier that day (March 3, 2014).
Waves overtop the beach on the north side of Roi-Namur Island and water runs into the nearby street.
On March 2, 2014, 5-meter-high waves with 15-second periods struck Roi-Namur Island, Kwajalein Atoll, during spring high tides, causing the largest overwash event in the Republic of the Marshall Islands since 2008.
Next to a road, a tall, two-story structure stands heavily damaged and ripped to shreds with a smashed upside-down boat.
Damage as seen in Natori, Japan, in May 2011. The March 11, 2011 magnitude 9.1 earthquake off the east coast of Japan caused an epic tsunami. USGS scientist standing near the wrecked boat, and a car on the road, provide scale. Damage to the building indicates a 10-meter flow depth.
A fishing boat lies wrecked in parking lot after being carried inland by large tsunami wave, a man walks in front of it.
Boat carried inland by tsunami that struck Sumatra on December 26, 2004.
Rubble lies in a layer of sand covering the ground of a village, and a wrecked boat transported by tsunami lies on its side.
Photo taken about 100 meters inland at Kalmunai on Sri Lanka's east coast.
A simple diagram shows the factors that can affect coastal cliff erosion
This simple diagram shows the factors that can affect coastal cliff erosion, including sea level rise, wave energy, coastal slope, beach width, beach height, and rock strength.
broken staircase and sand dune
High storm surge and wave runup during Hurricane Isabel (2003) caused widespread dune erosion in Nags Head, North Carolina. 
a dune that has been eroded several feet
Tropical Storm Eta affected beaches along Florida's Gulf Coast in November 2020. Some dunes were eroded up to several feet due to the high water levels associated with the storm. Madeira Beach is home to many people and animals, and erosion events such as this can affect both habitat and infrastructure. The USGS Coastal Change Hazards
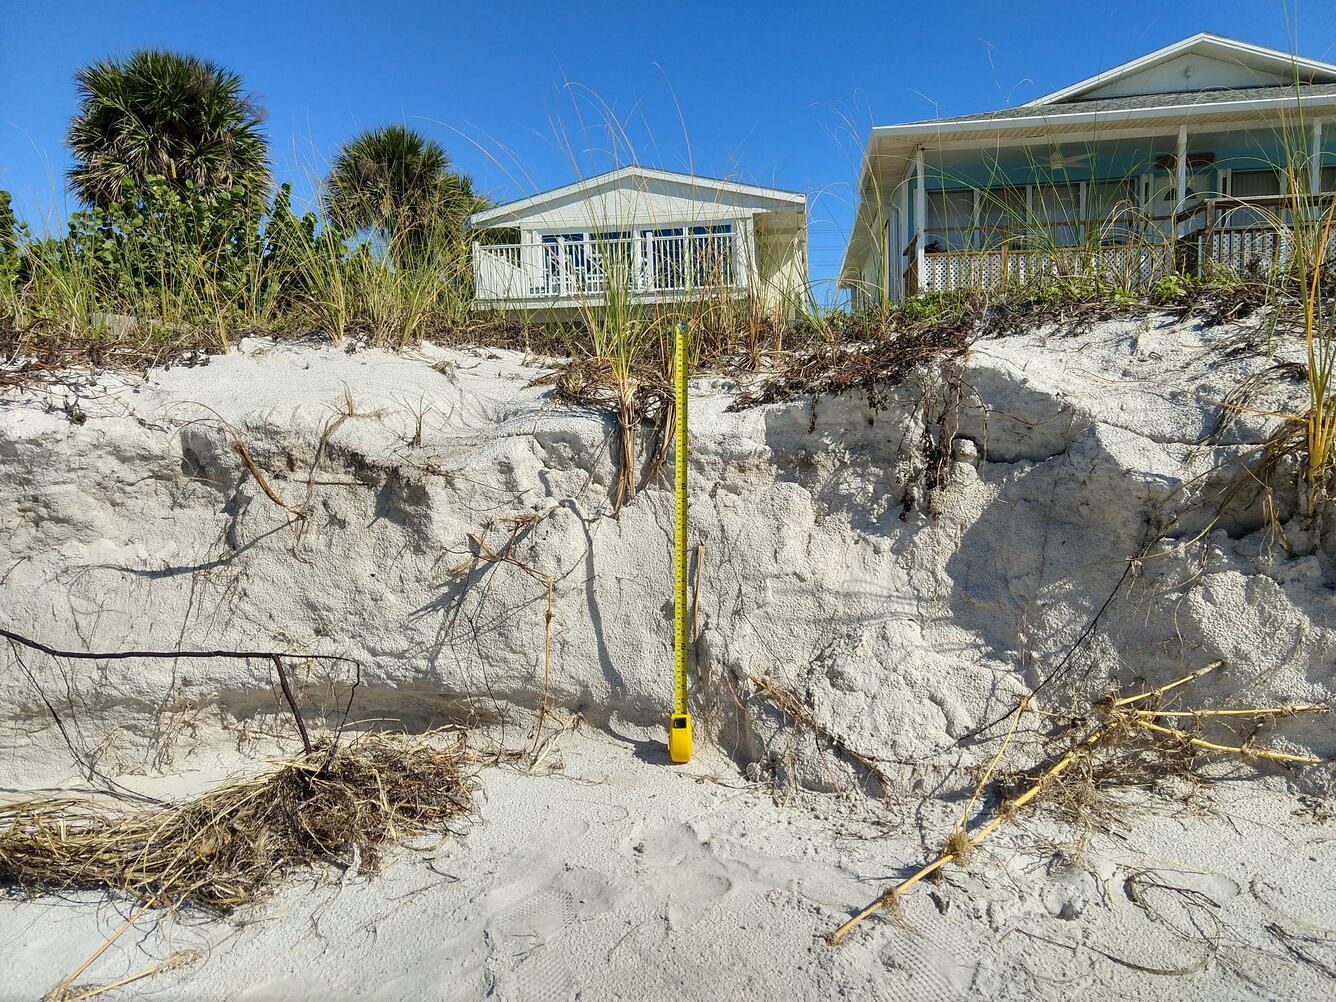
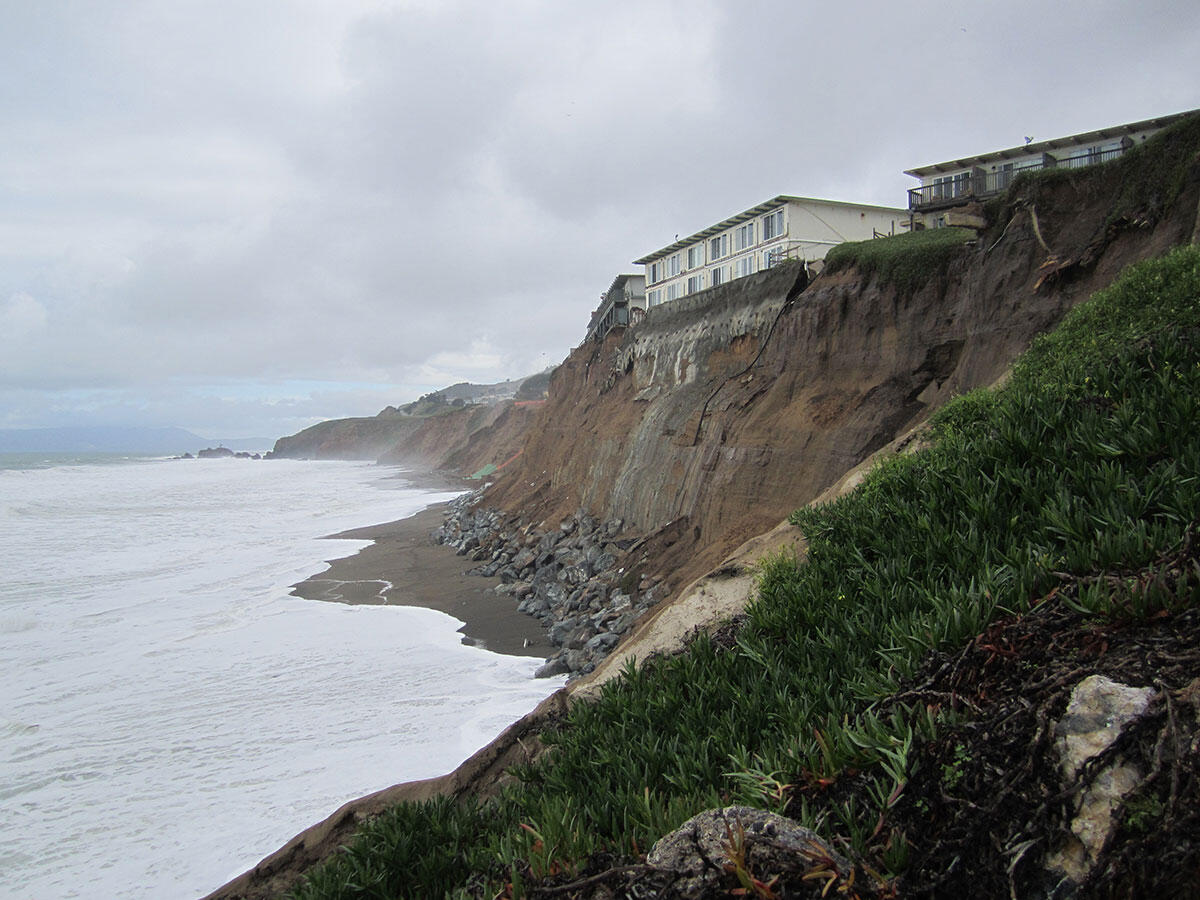
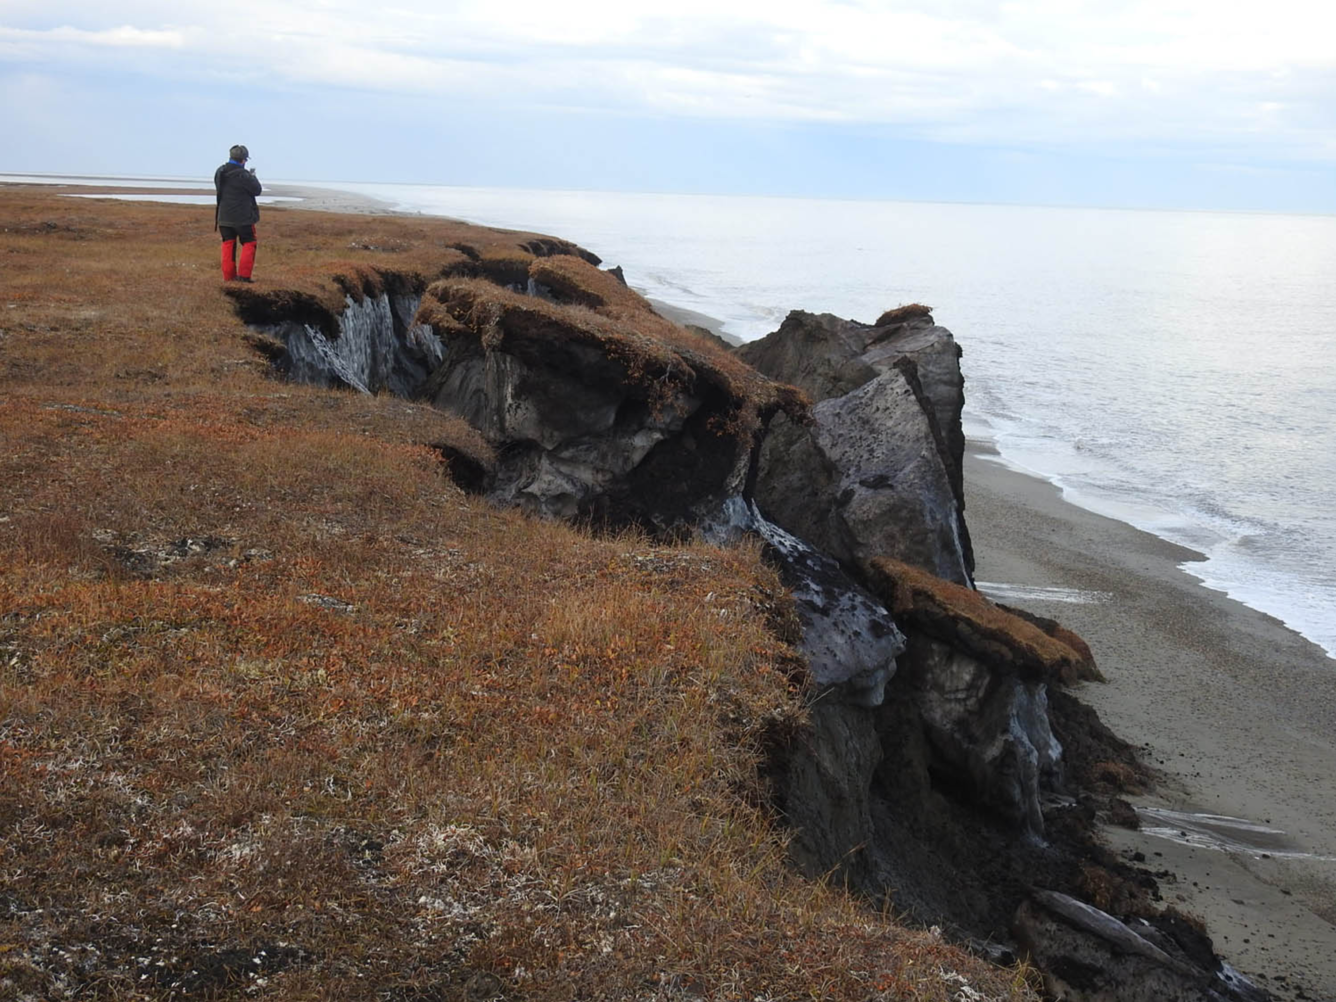
 team works to predict these erosion events so we can better prepare for coastal change. 
Photographs looking at a coastal cliff with a road covered by a landslide, then debris is cleared and road is repaired.
Time-lapse view of California Highway 1 reconstruction after 2017 landslideUSGS scientists produced an animated GIF in coordination with the California Department of Transportation (Caltrans) re-opening of State Highway 1 through Big Sur on July 18, 2018. In 2017, the massive Mud Creek landslide buried a quarter-mile of the famous coastal route with rocks and dirt more than 65 feet deep. As part of a new research project to monitor erosion along the landslide-prone cliffs of Big Sur, USGS scientists collected aerial photos before and after the slide, and during the construction project. By analyzing overlapping photos, they made precise maps of the slopes and calculated volumes of material lost or gained over time. Our researchers shared data and images with Caltrans to help ensure the safety of workers and the success of the road reconstruction.
Photo of a coastal cliff with an apartment building right at the edge of the cliff.
Cliff erosion is a common storm-induced hazard along the West Coast. Two condemned apartment buildings along Esplanade Avenue in Pacifica, California are shown here before their demolition in 2016 and 2017.
Recorded June 1, 2019 - August 18, 2019: Video shows a series of photos taken every hour during daylight hours in the summer of 2019. The camera looks westward along the coastal bluffs of Barter Island, located on Alaska’s North Slope. A pole on the bluff, visible in the first half of the video, once supported another video camera that was aimed at the shoreline to study wave and shoreline dynamics.This video starts on June 1st at -4°C (25° F) when the bluffs are still frozen, snow is on the ground, and the winter pack ice protects the permafrost cliffs from wave attack. By the end of June, the ice and snow are gone, temperatures often climb to 12°C (54° F), and waves begin to lap at the narrow beach below the bluffs.In mid-July, the now-thawed, upper active layer of the tundra begins to slough off onto the beach. By the end of July, waves accompanied with elevated storm-tides erode the lower part of the slope. Just days later, as erosion increases rapidly, the bluff supporting the camera gives way and the camera tumbles onto the beach. Despite its fall onto the muddy beach, the camera continued to record and was successfully recovered in order to create this video.The USGS is studying this highly erosive stretch of Arctic coastline to try to better understand the main driving forces behind the erosion and why erosion rates seem to be increasing. The increase is likely the result of several changing arctic conditions, including declining sea-ice extent, increasing summertime sea-surface temperature, rising sea level, and possible increases in storm power and corresponding wave action. More long-term work is needed to understand the interplay of these factors and how they drive changes in coastal erosion.
A person stands on tundra at the edge of a cliff that has gigantic chunks of eroded blocks tumbled down onto the beach.
Large blocks of coastal bluff tumble down onto the beach of Barter Island, on the North Slope of Alaska.


 Large waves breaking on cliffs in Santa Cruz, California; vegetation in the foreground and sea blends into sky in background
Large waves breaking on cliffs in Santa Cruz, California, February 13, 2016.
Large boulders have been placed along the beach edge to stop waves from eroding the sand. Palm trees stand behind the beach.
Installing large boulders as riprap to armor the shore against further erosion at Goleta Beach in Southern California. The tide is very low (negative).
waves cross a coastal road
Waves flood across a coastal road near Santa Cruz, California.
Cars, pedestrians, and homes alongside a coast with big waves hitting the cliffs and sections of the cliff have collapsed.
The coastal bluff along East Cliff Drive in Santa Cruz, California are especially vulnerable to rising sea level during big storms. Sometimes even the rip-rap, put in place to protect roadways and homes, cannot protect the bluffs from erosion.
Video Transcript
The ARkStorm scenario led by the USGS and hundreds of scientists and experts from many disciplines details impacts of a scientifically plausible storm similar to the Great California Storm of 1862 in the modern day. The scenario led to several important scientific advancements and will be used by emergency and resource managers to improve partnerships and emergency preparedness. Learn more: The ARkStorm Overview at https://pubs.usgs.gov/of/2010/1312/
View of a coastal city from the sky, with polygons drawn along the coast to show flooding areas.
Map showing the simulated flooding for a 100-year storm event with (blue) and without (red) coral reefs in San Juan, Puerto Rico. The red area thus represents the area protected by coral reefs.
Two people sit on the remains of a building looking at debris on a street with bent-over parking meter in foreground.
Aftermath of the 1960 Chilean tsunami in Hilo, Hawaii, where the tsunami caused 61 deaths.

Get Our News

These items are in the RSS feed format (Really Simple Syndication) based on categories such as topics, locations, and more. You can install and RSS reader browser extension, software, or use a third-party service to receive immediate news updates depending on the feed that you have added. If you click the feed links below, they may look strange because they are simply XML code. An RSS reader can easily read this code and push out a notification to you when something new is posted to our site.