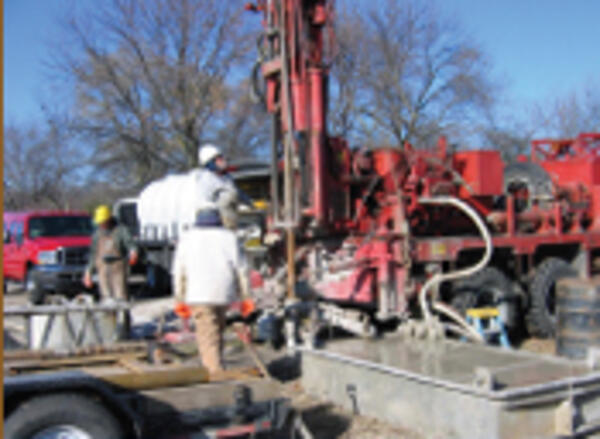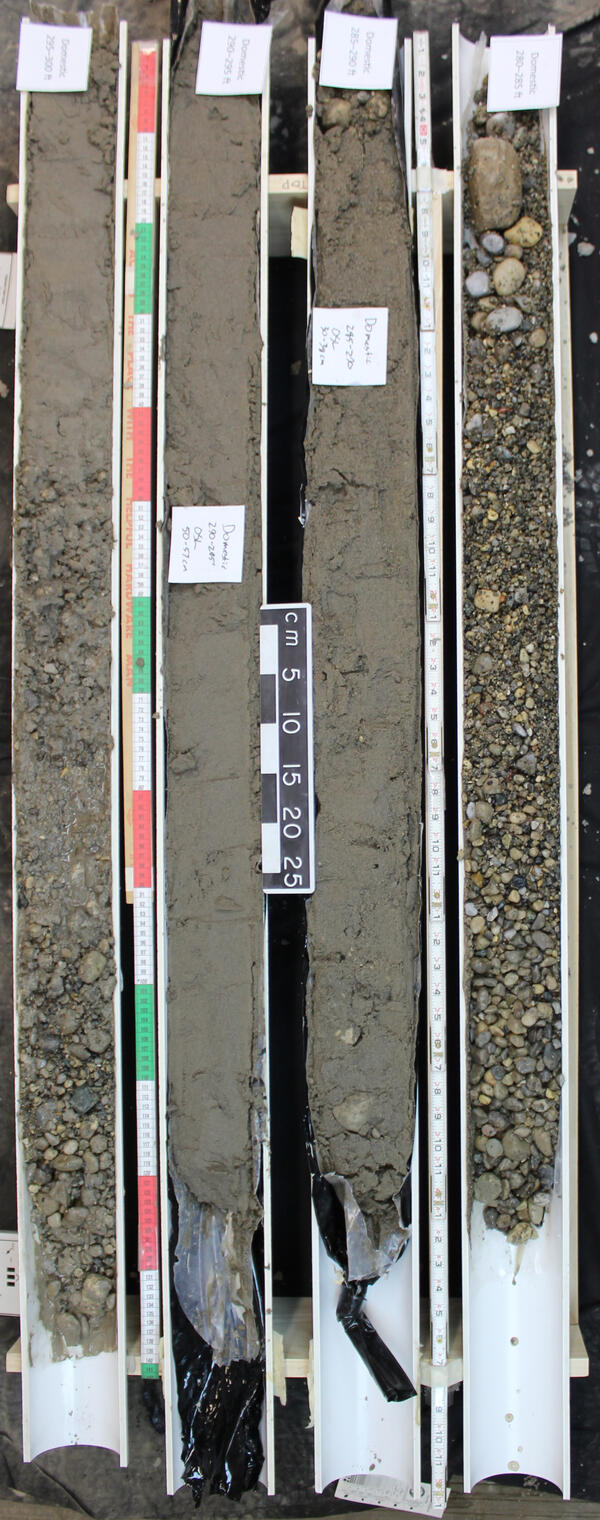
Indiana Geological and Water Survey "golden spike" drill core.
Indiana Geological and Water Survey "golden spike" drill core.This is a 20 foot section of a drill core collected by the Indiana Geological and Water Survey (IGWS). IGWS geologists dub these cores "golden spikes" when they are drilled deep enough to reach the underlying bedrock.