
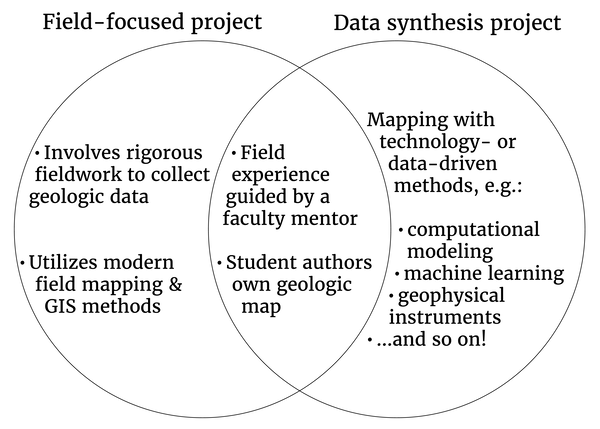
Each EDMAP proposal is categorized as either a "Field-Focused" of "Data Synthesis" project, but proposals may combine elements of both project types. Both types of EDMAP projects require a mentor-guided field experience and for each primary student mapper to produce their own first-author geologic map.
Images
Images intro.
Filter Total Items: 57
EDMAP project types venn diagram.png
Each EDMAP proposal is categorized as either a "Field-Focused" of "Data Synthesis" project, but proposals may combine elements of both project types. Both types of EDMAP projects require a mentor-guided field experience and for each primary student mapper to produce their own first-author geologic map.
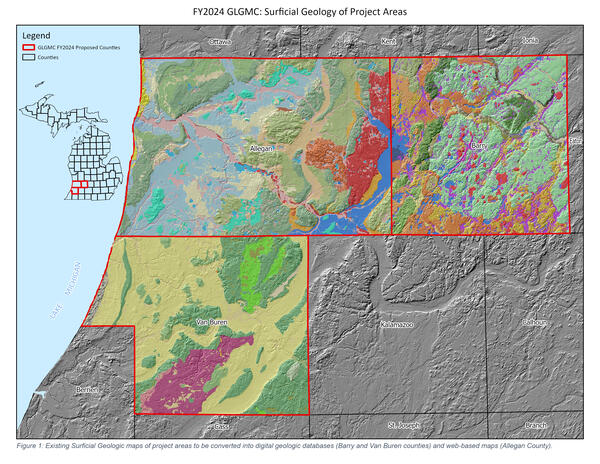
2024 GLGMC: Surficial Geology of Project Areas within Michigan
2024 GLGMC: Surficial Geology of Project Areas within MichiganExisting surficial geologic maps of project areas to be converted to digital geologic databases (Barry and Van Buren counties) and web-based maps (Allegan County).
2024 GLGMC: Surficial Geology of Project Areas within Michigan
2024 GLGMC: Surficial Geology of Project Areas within MichiganExisting surficial geologic maps of project areas to be converted to digital geologic databases (Barry and Van Buren counties) and web-based maps (Allegan County).
NCGMP STATEMAP partners
This picture shows several STATEMAP partners and NCGMP staff during an AASG annual meeting.
This picture shows several STATEMAP partners and NCGMP staff during an AASG annual meeting.

230.jpg
Each year, the US Geological Survey National Cooperative Geologic Mapping Program, in partnership with the Association of American State Geologists, the American Institute of Professional Geologists, Geological Society of America (GSA), and American Geosciences Institute hosts the annual Best Student Geologic Map Competition (BSGMC)
Each year, the US Geological Survey National Cooperative Geologic Mapping Program, in partnership with the Association of American State Geologists, the American Institute of Professional Geologists, Geological Society of America (GSA), and American Geosciences Institute hosts the annual Best Student Geologic Map Competition (BSGMC)

2024 BSGMC 1st Place.jpg
BSGMC 2024 first place winner is Andrew Yokel-Deliduka with AASG President Jessica Moore and Brunton CEO Lauren Heerschap
BSGMC 2024 first place winner is Andrew Yokel-Deliduka with AASG President Jessica Moore and Brunton CEO Lauren Heerschap

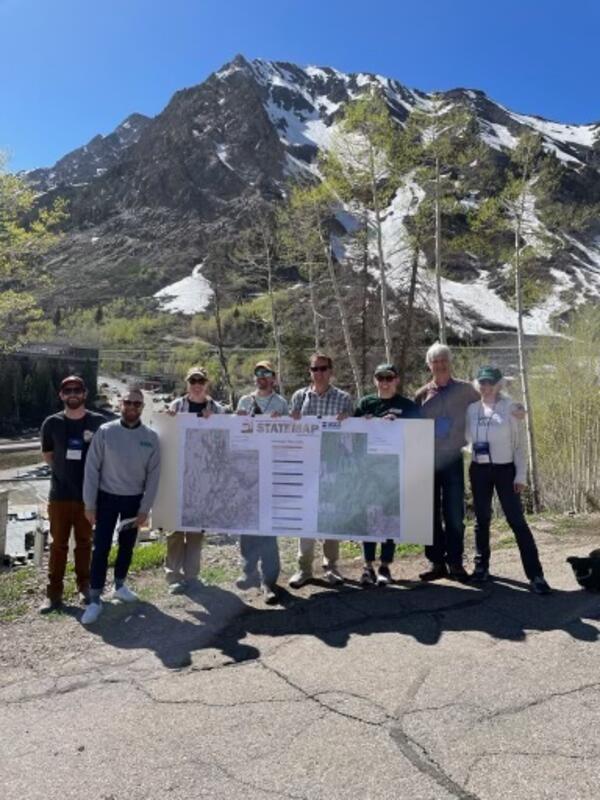
STATEMAP Partners
STATEMAP Partners gather in Park City Utah during the annual meeting of the Association of American State Geologists
STATEMAP Partners gather in Park City Utah during the annual meeting of the Association of American State Geologists
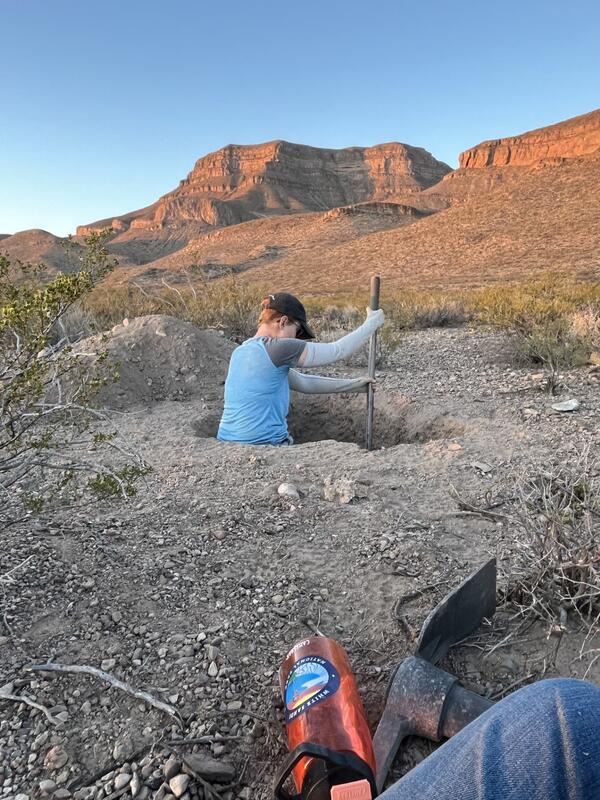
EDMAP FY23_NMT_Prush field photo2.jpg
Fault mapping: George Pharris, an EDMAP student from New Mexico Tech, is digging a soil pit to date a surface offset of the Quaternary-active Alamogordo fault, in central New Mexico.
Fault mapping: George Pharris, an EDMAP student from New Mexico Tech, is digging a soil pit to date a surface offset of the Quaternary-active Alamogordo fault, in central New Mexico.
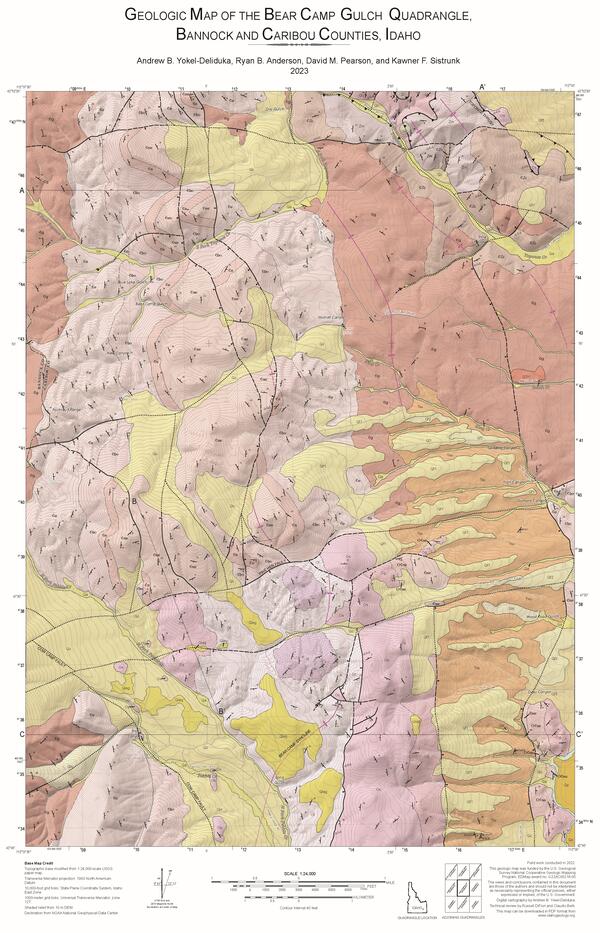
EDMAP Geologic Map of the Bear Camp Gulch Quadrangle, Bannock and Caribou Counties, Idaho
EDMAP Geologic Map of the Bear Camp Gulch Quadrangle, Bannock and Caribou Counties, IdahoThe Geologic Map of the Bear Camp Gulch Quadrangle started out as an EDMAP project at Idaho State University. EDMAP student Andrew Yokel-Deliduka worked with the Idaho Geological Survey to publish the map and presented it at GSA Connects 2024 to win the Best Student Geologic Map Competition. The image used here is an excerpt from the original product.

EDMAP Flyer 2023_Page1.png
Title banner from the USGS NCGMP 2023 STATEMAP Factsheet to be used to support communication and outreach
Title banner from the USGS NCGMP 2023 STATEMAP Factsheet to be used to support communication and outreach

EDMAP NMT Field photo surface mapping
A professor and EDMAP student confer about Quaternary surface mapping along the Alamogordo fault in central New Mexico.
From a 2023 EDMAP project at NM Tech mapping Quaternary slip rate along the Alamogordo fault (New Mexico) using both remote sensing and field-based methods
A professor and EDMAP student confer about Quaternary surface mapping along the Alamogordo fault in central New Mexico.
From a 2023 EDMAP project at NM Tech mapping Quaternary slip rate along the Alamogordo fault (New Mexico) using both remote sensing and field-based methods
Grand_Canyon_20230908_Brennan.jpg
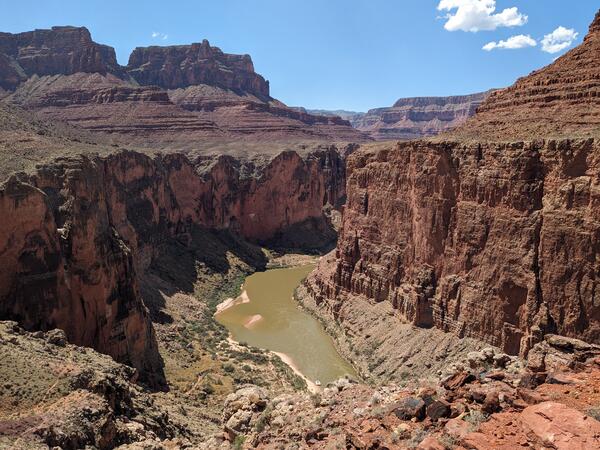
Photograph of the Colorado River in the Grand Canyon, Arizona, USA. Photo taken on September 8, 2023.
By
Core Science Systems Mission Area, Natural Hazards Mission Area, Water Resources Mission Area, Mineral Resources Program, National Cooperative Geologic Mapping Program, National Water Quality Program, Toxic Substances Hydrology, Geology, Geophysics, and Geochemistry Science Center, Geology, Minerals, Energy, and Geophysics Science Center, Geosciences and Environmental Change Science Center, New Mexico Water Science Center, Southwest Biological Science Center, Denver Radiogenic Isotope Lab, National Water Quality Laboratory, New Mexico Water Science Center Sediment Laboratory, Organic Geochemistry Laboratory, Geological Materials Repository, Geology and Ecology of National Parks, Colorado River Basin: Actionable and Strategic Integrated Science and Technology

USGIP&P.png
Partners and processes supporting the USGI to demonstrate how components support the gathering and synthesis of geologic data to help construct a 2D/3D GeoFramework model of the United States.
Partners and processes supporting the USGI to demonstrate how components support the gathering and synthesis of geologic data to help construct a 2D/3D GeoFramework model of the United States.

Two-Dimensional National Map Illustration
Two-dimensional (2D) National Map Illustration in support of U.G. GeoFramework Initiative (USGI)
Two-dimensional (2D) National Map Illustration in support of U.G. GeoFramework Initiative (USGI)

NGS.png
Illustration of NGS activities in bringing together national and continental-resolution 2D and 3D geologic data
Illustration of NGS activities in bringing together national and continental-resolution 2D and 3D geologic data

National Subsurface Geology Explorer - Top Basement
National Subsurface Geology Explorer - Top BasementNational Subsurface Geology Explorer - Top Basement
National Subsurface Geology Explorer - Top Basement - ScienceBase-Catalog
National Subsurface Geology Explorer - Top Basement
National Subsurface Geology Explorer - Top BasementNational Subsurface Geology Explorer - Top Basement
National Subsurface Geology Explorer - Top Basement - ScienceBase-Catalog

USGI Fact Sheet Figure.png
Illustration of USGI partners and Cooperators; USGI supports NCGMP efforts to “bring together detailed national and continental-resolution 2D and 3D information produced throughout the Survey and by federal and state partners.”
Illustration of USGI partners and Cooperators; USGI supports NCGMP efforts to “bring together detailed national and continental-resolution 2D and 3D information produced throughout the Survey and by federal and state partners.”

USGI Graphic.png
Illustration of USGI GeoFramework model; USGI supports Congressional mandate for NCGMP to “bring together detailed national and continental-resolution 2D and 3D information produced throughout the Survey and by federal and state partners.”
Illustration of USGI GeoFramework model; USGI supports Congressional mandate for NCGMP to “bring together detailed national and continental-resolution 2D and 3D information produced throughout the Survey and by federal and state partners.”

Digital data for three-dimensional geologic framework model of the Rio San Jose groundwater basin, New Mexico: U.S. Geological Survey data release (Sweetkind and others, 2020, https://doi.org/10.5066/P9MPAGA7)
Digital data for three-dimensional geologic framework model of the Rio San Jose groundwater basin, New Mexico: U.S. Geological Survey data release (Sweetkind and others, 2020, https://doi.org/10.5066/P9MPAGA7)3D geologic framework model from west-central New Mexico; graphic shows stratigraphic units in the model being sequentially removed to reveal the deeper units. Faults used in the model appear as vertical “ribbons” as geologic layers are removed.
Digital data for three-dimensional geologic framework model of the Rio San Jose groundwater basin, New Mexico: U.S. Geological Survey data release (Sweetkind and others, 2020, https://doi.org/10.5066/P9MPAGA7)
Digital data for three-dimensional geologic framework model of the Rio San Jose groundwater basin, New Mexico: U.S. Geological Survey data release (Sweetkind and others, 2020, https://doi.org/10.5066/P9MPAGA7)Digital data for three-dimensional geologic framework model of the Rio San Jose groundwater basin, New Mexico: U.S. Geological Survey data release (Sweetkind and others, 2020, https://doi.org/10.5066/P9MPAGA7)
Digital data for three-dimensional geologic framework model of the Rio San Jose groundwater basin, New Mexico: U.S. Geological Survey data release (Sweetkind and others, 2020, https://doi.org/10.5066/P9MPAGA7)3D geologic framework model from west-central New Mexico; graphic shows stratigraphic units in the model being sequentially removed to reveal the deeper units. Faults used in the model appear as vertical “ribbons” as geologic layers are removed.
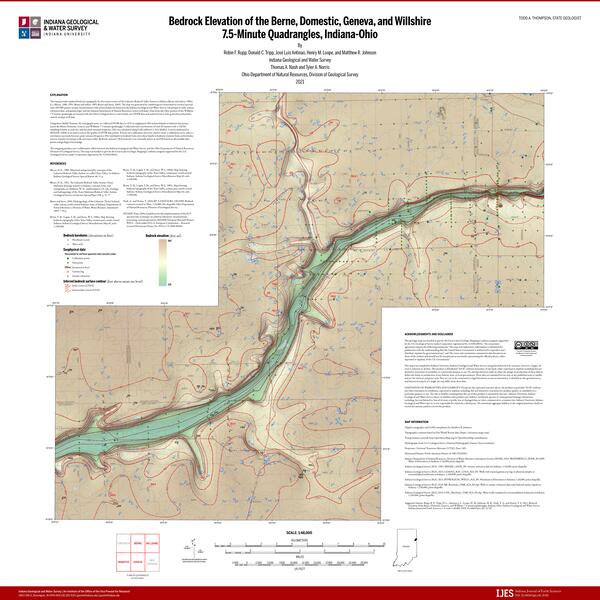
Bedrock Elevation of the Berne, Domestic, Geneva, and Willshire 7.5-Minute Quadrangles, Indiana-Ohio
Bedrock Elevation of the Berne, Domestic, Geneva, and Willshire 7.5-Minute Quadrangles, Indiana-OhioThis map is an updated bedrock topography map for the eastern extent of the Lafayette Bedrock Valley System in Indiana and Ohio which depicts a portion of an ancient river drainage valley. This image is used with the permission of the Indiana Geological and Water Survey and the Ohio Department of Natural Resources, Division of Geological Survey.

Field photo of core drilling collaboration project between Indiana and Ohio
Field photo of core drilling collaboration project between Indiana and OhioThis is a field photo of geologists from the Indiana Geological and Water Survey and Ohio Geological Survey conducting core drilling of glacial sediments. The information gained from this project aided in the development of a bedrock topography map of a buried ancient river bed.
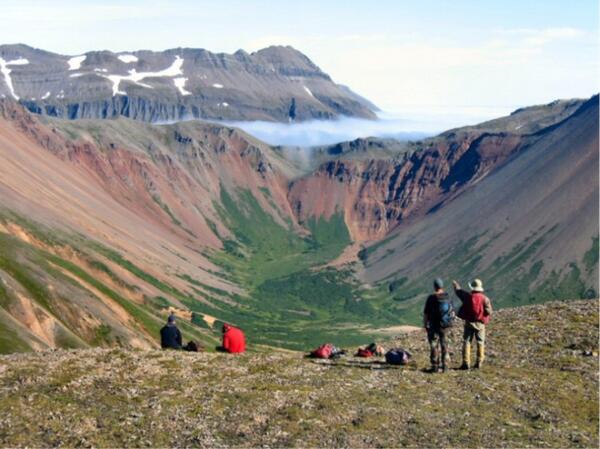
EDMAP students conducting geologic mapping field work
EDMAP students conducting geologic mapping field workPhoto of several students conducting geologic mapping field work as part of an EDMAP student project.
EDMAP students conducting geologic mapping field work
EDMAP students conducting geologic mapping field workPhoto of several students conducting geologic mapping field work as part of an EDMAP student project.