U.S. flag

An official website of the United States government

Images

Images intro.
Filter Total Items: 57
Grey background map of the US and Canada focused on the region around the Great Lakes with geologic map overlay in a variety
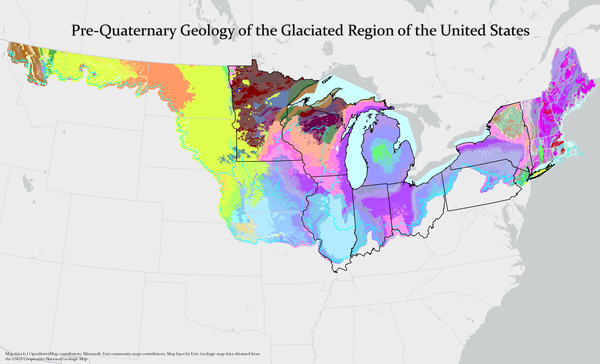
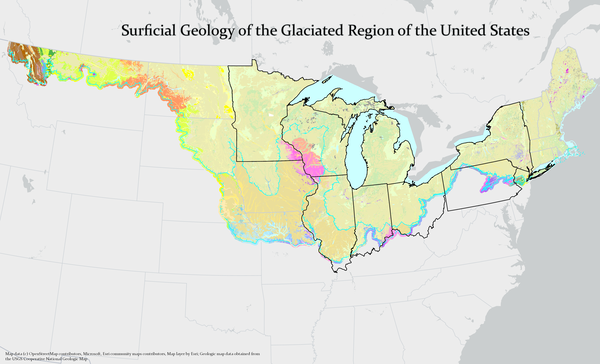
Surficial Geology of the Glaciated Region of the US

This is a partial representation of a geologic map of the Surficial geology of the glaciated region of the US. The blue dashed lines represent glacial and glaciofluvial features, roughly outlining the boundary of the glaciated region. The black outlined states represent the eight member states of the Great Lakes Geologic Mapping Coalition. 

This is a partial representation of a geologic map of the Surficial geology of the glaciated region of the US. The blue dashed lines represent glacial and glaciofluvial features, roughly outlining the boundary of the glaciated region. The black outlined states represent the eight member states of the Great Lakes Geologic Mapping Coalition. 

Map showing all 50 US States in varying shades of green depicting darker shades as increased funding amounts.
STATEMAP Funding Map 1993 - 2025.png

This chart depicts funding amounts in US dollars awarded by the NCGMP's STATEMAP program by state for the time period between 1993 and 2025. Paler hues indicate lower funding amounts (with white being no funding), where darker hues show higher funding amounts. 

This chart depicts funding amounts in US dollars awarded by the NCGMP's STATEMAP program by state for the time period between 1993 and 2025. Paler hues indicate lower funding amounts (with white being no funding), where darker hues show higher funding amounts. 

Screen clipped image showing the surficial geology of Boone County above and a subsurface diagram below using different color
3D view of surficial geology and subsurface cross section within Boone County, IL

This screen clipped image was generated with the Illinois State Geological Survey's 3D viewer. This map shows the surficial geology of Boon County, Illinois above a generated cross section along the red diagonal indicator line.

US map centered on great lakes region with each state outlined in varying shades of blue darker indicating the state received more GLGMC funding
GLGMC Funding history 2009 - 2025

This graphic shows the distribution and total US dollar amount of funding received by each GLGMC member state between 2009 and 2025 since the Coalition has been part of the National Cooperative Geologic Mapping Program.

This graphic shows the distribution and total US dollar amount of funding received by each GLGMC member state between 2009 and 2025 since the Coalition has been part of the National Cooperative Geologic Mapping Program.

Grey background map of the US and Canada focused on the region around the Great Lakes with geologic map overlay in a variety of colors.
Pre-Quaternary Geology of the Glaciated Region of the US

This is a partial representation of a geologic map of the Pre-Quaternary geology of the glaciated region of the US. The blue dashed lines represent glacial and glaciofluvial features, roughly outlining the boundary of the glaciated region. The black outlined states represent the eight member states of the Great Lakes Geologic Mapping Coalition. 

This is a partial representation of a geologic map of the Pre-Quaternary geology of the glaciated region of the US. The blue dashed lines represent glacial and glaciofluvial features, roughly outlining the boundary of the glaciated region. The black outlined states represent the eight member states of the Great Lakes Geologic Mapping Coalition. 

Street map of area within McHenry County IL above subsurface cross section showing rock units in different colors
Cross section within McHenry County, IL created with 3D viewer along area of proposed development

This image shows a street map within McHenry County, Illinois (above). The red line indicates the location of the geologic cross section (below). The red line shows an area of proposed development and the cross section indicates the existence of a sensitive aquifer along that locator line. 

This image shows a street map within McHenry County, Illinois (above). The red line indicates the location of the geologic cross section (below). The red line shows an area of proposed development and the cross section indicates the existence of a sensitive aquifer along that locator line. 

Map of the state of Illinois including county boundaries showing distribution of glacial deposits in different colors.
Glacial Terrain of Illinois

This map shows the generalized glaciated terrain of the state of Illinois. For more information, visit the Illinois State Geological Survey website. 

Photograph of six people on a stage with a blue background and high banner reading "Innovation Stage."
BSGMC 2025 Winners Stage

This is an image of the top two winners from the competition holding their awards along with contest sponsors. 

This is an image of the top two winners from the competition holding their awards along with contest sponsors. 

Photograph of a geologic map poster.
Franklin Lake Second Place BSGMC 2025.jpg

This picture illustrates a BSGMC participant student poster presented at GSA. 

Terry Lee from the University of Nevada, Reno, 1:24,000-Scale Geologic Map of the Western Half of the Franklin Lake NW 7.5-Minute Quadrangle, Ruby Mountains-East Humboldt Range Metamorphic Core Complex, Northeast Nevada.

Photograph of a geologic map poster.
Salt Structures Third Place BSGMC 2025

This picture illustrates a BSGMC participant student poster presented at GSA. 

David Canova, University of Barcelona, Salt structures in the Eastern External Betics fold and thrust belt, SE Iberia—Geologic maps, cross sections, and palinspastic reconstructions. 

This picture illustrates a BSGMC participant student poster presented at GSA. 

David Canova, University of Barcelona, Salt structures in the Eastern External Betics fold and thrust belt, SE Iberia—Geologic maps, cross sections, and palinspastic reconstructions. 

A student stands to the left of their geologic map poster gesturing towards it while presenting the information.
EDMAP BSGMC GSA2025 218 Matthew Crane Pinegrass Ridge2.jpg

This is an image of Matthew Crane presenting his entry geologic map poster of Pinegrass Ridge for the 2025 Best Student Geologic Map Competition. 

Large green rectangular sign reading "Best Student Geologic Map Competition"
BSGMC Sign GSA 2025
BSGMC Sign GSA 2025
BSGMC Sign GSA 2025

This is an image of the sign that was placed at the 2025 GSA annual meeting to designate the USGS NCGMP-hosted BSGMC. 

This is an image of the sign that was placed at the 2025 GSA annual meeting to designate the USGS NCGMP-hosted BSGMC. 

Four people standing to the right side of a geologic map poster. The person closest to the poster is gesturing towards it as they present the information.
EDMAP GSA2025 209 Terri Zach Ryan Thigpen; Survey Peak, WY.jpg

Terri Zach (left), First Place winner of the 2025 Best Student Geologic Map Competition from the University of Kentucky (UK), presents their geologic map of the Survey Peak quadrangle, WY, in front of their UK EDMAP mentor Dr. Ryan Thigpen, fellow UK graduate student Jillian Cavellier, and Nevada Bureau of Mines and Geology Geologic Mapping Program Manager, Dr.

Terri Zach (left), First Place winner of the 2025 Best Student Geologic Map Competition from the University of Kentucky (UK), presents their geologic map of the Survey Peak quadrangle, WY, in front of their UK EDMAP mentor Dr. Ryan Thigpen, fellow UK graduate student Jillian Cavellier, and Nevada Bureau of Mines and Geology Geologic Mapping Program Manager, Dr.

Photograph of a geologic map poster.
Survey Peak First Place BSGMC 2025

This picture illustrates a BSGMC participant student poster presented at GSA. 

Terri Zach, University of Kentucky, Geology of the Survey Peak 7.5' Quadrangle, Wyoming: Using Detailed Mapping to Reconstruct the Paleo-Topography of the Northern Teton Range and Implications for the Paleo-Teton Collapse Hypothesis.

A simulated picture of a smartphone showing the new USGS Cooperative National Geologic Map web tool
The USGS Cooperative National Geologic Map on smartphone
A smartphone screenshot of the new USGS Cooperative National Geologic Map web tool showing its mobile friendly
The USGS Cooperative National Geologic Map on a smartphone
Image shows a 3D computer rendering of subsurface geology in different colors.
3D View of the Surficial Geology, Bedrock Topography and Water Well Data, Allegan County, Michigan

This is a preliminary image of the 3D geologic map of Allegan County, Michigan which will be part of the Allegan County web map being created by the Michigan Geological Survey. 

Depiction of the Geoheritage Sites of the Nation Explorer showing the continental United States with green location markers of geoheritage sites.
Geoheritage Explorer.jpg

This is an image of the Geoheritage Sites of the Nation Explorer, which is an interactive web map application featuring the 55 geoheritage sites from the Geoheritage Sites of the Nation Data Release v.1. 

This is an image of the Geoheritage Sites of the Nation Explorer, which is an interactive web map application featuring the 55 geoheritage sites from the Geoheritage Sites of the Nation Data Release v.1. 

A geologic map of the state of Wisconsin.
Quaternary Geology of Wisconsin

This is a geologic map showing the Quaternary geology of the state of Wisconsin. It is an update to an older map that was published in 2025 after many years of mapping done by the Wisconsin Geological and Natural History Survey. 

This is a geologic map showing the Quaternary geology of the state of Wisconsin. It is an update to an older map that was published in 2025 after many years of mapping done by the Wisconsin Geological and Natural History Survey. 

Report that provides the first economic analysis of geological mapping conducted for the entire United States.
geologicalmappingeconomics.png

Cover picture of the report titled Economic Analysis of the Costs and Benefits of Geological Mapping in the United States of America from 1994 to 2019.

Cover picture of the report titled Economic Analysis of the Costs and Benefits of Geological Mapping in the United States of America from 1994 to 2019.

Was this page helpful?