
Around 90% of daily water use in the lower 48 United States goes toward crop irrigation, thermoelectric power plants, where freshwater is used in the process of creating energy, and public supply, where water is withdrawn or purchased by a water supplier and delivered to many users. These three uses add up to 224,000 million gallons of freshwater per day.
Images
Discover and download images and data visualizations that support the National and Regional Water Availability Assessments.
Filter Total Items: 31

Water Use in the U.S. - daily water use
Around 90% of daily water use in the lower 48 United States goes toward crop irrigation, thermoelectric power plants, where freshwater is used in the process of creating energy, and public supply, where water is withdrawn or purchased by a water supplier and delivered to many users. These three uses add up to 224,000 million gallons of freshwater per day.

Water use map (2020)
Average daily water use for the top 3 water use categories in the lower 48 states: thermoelectric power generation, public supply, and crop irrigation.
Average daily water use for the top 3 water use categories in the lower 48 states: thermoelectric power generation, public supply, and crop irrigation.

Consumptive water use
Not all water withdrawals are returned to the local environment. Some water is lost because it is evaporated, transpired, incorporated into products or crops, or otherwise made unavailable for immediate use.
Not all water withdrawals are returned to the local environment. Some water is lost because it is evaporated, transpired, incorporated into products or crops, or otherwise made unavailable for immediate use.
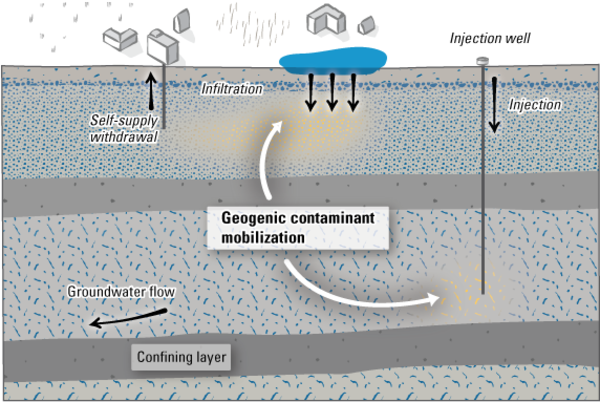
Geogenic contaminant mobilization illustration
Managed aquifer-recharge methods and processes. Managed recharge—which uses water of dissimilar geochemistry from groundwater through infiltration into shallow aquifers or injection into deep aquifers—can alter hydrologic and geochemical aquifer conditions such that arsenic and other geogenic contaminants are mobilized from sediment to aqueous phase.
Managed aquifer-recharge methods and processes. Managed recharge—which uses water of dissimilar geochemistry from groundwater through infiltration into shallow aquifers or injection into deep aquifers—can alter hydrologic and geochemical aquifer conditions such that arsenic and other geogenic contaminants are mobilized from sediment to aqueous phase.

Sources of Nitrogen across hydrologic regions (percent)
Sources of Nitrogen across hydrologic regions (percent)A stacked bar chart showing the relative sources of Nitrogen across hydrologic regions of CONUS (2010-2020). Colors show the percent of total Nitrogen load contributed from agriculture, atmospheric deposition, natural sources, wastewater, and other human sources.

IWAAs national release graphic
Graphic developed for the release of the National Water Availability Assessment in January 2025.
Graphic developed for the release of the National Water Availability Assessment in January 2025.

Temperature logger in Santiam River basin, Oregon
Temperature logger attached to submerged cobble in Quartzville Creek, OR. This logger was placed as part of an ongoing effort to retrieve continuous temperature data from rivers and tributaries within the Willamette River basin, OR.
Temperature logger attached to submerged cobble in Quartzville Creek, OR. This logger was placed as part of an ongoing effort to retrieve continuous temperature data from rivers and tributaries within the Willamette River basin, OR.

IWAAs Product Overlap (media item)
The three National Water Availability Assessment products are designed to be interdependent:
The three National Water Availability Assessment products are designed to be interdependent:

IWAAs product interdependencies (Media Item)
The three Integrated Water Availability Assessment products are designed to be interdependent:
The three Integrated Water Availability Assessment products are designed to be interdependent:

IWAAs - levels of water limitations
Water limitation across the lower 48 United States, shown as the average from 2010 to 2020 for each watershed (HUC12). Water limitation levels were based on the surface water supply and use index, which expresses the imbalance between surface water-supply and consumptive use.
Water limitation across the lower 48 United States, shown as the average from 2010 to 2020 for each watershed (HUC12). Water limitation levels were based on the surface water supply and use index, which expresses the imbalance between surface water-supply and consumptive use.