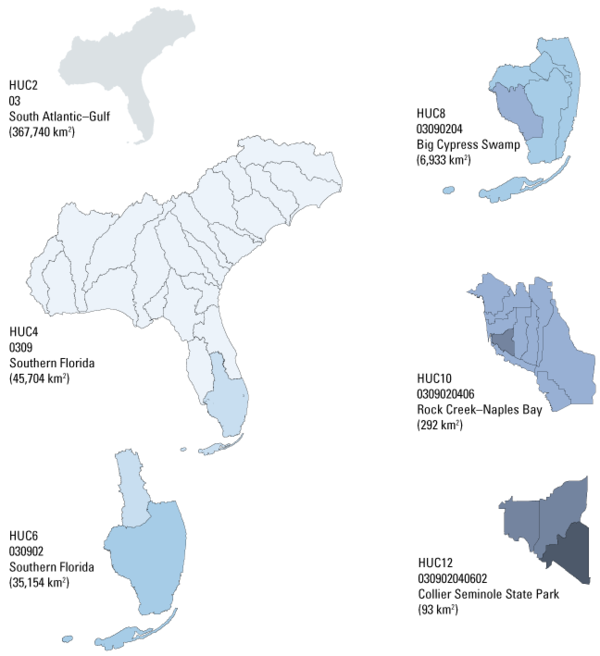
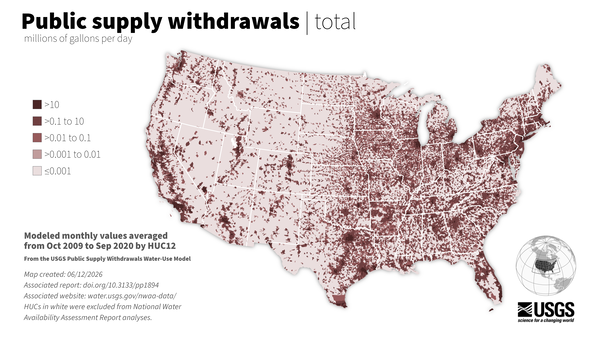
U.S. flag

An official website of the United States government

Images

Discover and download images and data visualizations that support the National and Regional Water Availability Assessments.

Filter Total Items: 26
Images that represent downloading integrated water data
National Water Availability Assessment Data Companion capabilities

Images representing three of the services available to users of the National Water Availability Assessments (NWAA) Data Companion. Services include subset and download tool, data file directory, and web services. 

3D render of Upper Colorado River Basin
3D render of Illinois River Basin

3D render of the Illinois River Basin, created using TopoRivBlender. Read more about this method at https://waterdata.usgs.gov/blog/topo-riv-blender/ 

Map of the Upper Colorado River Basin, Integrated Water Availability Assessment.
Map of Upper Colorado River Basin - Integrated Water Availability

Map of the Upper Colorado River Basin —referred to as an Integrated Water Science (IWS) basins—are intensively monitored study basins representing a wide range of environmental, hydrologic, and landscape settings and human stressors of water resources to improve our understanding of water availability across the Nation.

Map of the Upper Colorado River Basin —referred to as an Integrated Water Science (IWS) basins—are intensively monitored study basins representing a wide range of environmental, hydrologic, and landscape settings and human stressors of water resources to improve our understanding of water availability across the Nation.

see caption
Integrated Water Science in the Klamath River Basin, Diagram

Water availability in the Klamath Basin is shaped by three interconnected factors, like overlapping circles in a Venn diagram. First, upper basin controls—such as groundwater, snowpack, and runoff—determine how much water is available. Second, biological opinions set flow requirements to protect endangered fish and habitats, including flushing and geomorphic flows.

Water availability in the Klamath Basin is shaped by three interconnected factors, like overlapping circles in a Venn diagram. First, upper basin controls—such as groundwater, snowpack, and runoff—determine how much water is available. Second, biological opinions set flow requirements to protect endangered fish and habitats, including flushing and geomorphic flows.

HUC diagram showing the hierarchical, nested way in which HUCs are named
Hydrologic Unit Code (HUC) overview

The U.S. Geological Survey uses a depiction and classification scheme for hydrologic units known as hydrologic unit codes (HUCs). HUCs generally represent catchments, and river basins are represented by a unique series of numbers with successively smaller hydrologic units nested inside of larger ones.

The U.S. Geological Survey uses a depiction and classification scheme for hydrologic units known as hydrologic unit codes (HUCs). HUCs generally represent catchments, and river basins are represented by a unique series of numbers with successively smaller hydrologic units nested inside of larger ones.

Stacked bar chart showing the sources of nitrogen by U.S. regions
Sources of Nitrogen across hydrologic regions (total load)

A stacked bar chart showing the sources of Nitrogen across hydrologic regions of CONUS (2010-2020). Colors show the total Nitrogen load contributed from agriculture, atmospheric deposition, natural sources, wastewater, and other human sources.

A stacked bar chart showing the sources of Nitrogen across hydrologic regions of CONUS (2010-2020). Colors show the total Nitrogen load contributed from agriculture, atmospheric deposition, natural sources, wastewater, and other human sources.

Map showing water limitation using five categories (very low to severe)
Water limitation (2010-2020)

Water limitation across the lower 48. Water limitation is measured as the Supply and Use Index (SUI) which represents the imbalance between water supply and demand. A higher SUI indicates a greater proportion of supply being used. 

Water limitation across the lower 48. Water limitation is measured as the Supply and Use Index (SUI) which represents the imbalance between water supply and demand. A higher SUI indicates a greater proportion of supply being used. 

Map of continental U.S. showing aquifer extents
Drinking water aquifers

A simplified drinking water aquifer map of CONUS. Overlapping aquifers are indicated with striping.

A simplified drinking water aquifer map of CONUS. Overlapping aquifers are indicated with striping.

Chart showing surface water supply and demand by U.S. hydrologic region
Water supply vs demand 2010-2020

Surface water supply and demand across hydrologic regions (2010-2020). Surface water supply is shown as average surface runoff, and demand reflects consumptive use.

Surface water supply and demand across hydrologic regions (2010-2020). Surface water supply is shown as average surface runoff, and demand reflects consumptive use.

Bar charts showing average daily water use by water-use type (public supply, thermoelectric power, and crop irrigation).
Water use 2010-2020 by type

Total water use for the top 3 water use categories: thermoelectric power generation, public supply, and crop irrigation. These three categories make up 90% of all water use in the contiguous United States. 

Total water use for the top 3 water use categories: thermoelectric power generation, public supply, and crop irrigation. These three categories make up 90% of all water use in the contiguous United States. 

Stacked bar chart showing total water use by year and water use type.
Total water use (2010-2020)

Total water use for the top 3 water use categories: thermoelectric power generation, public supply, and crop irrigation. These three categories make up 90% of all water use in the contiguous United States.

Total water use for the top 3 water use categories: thermoelectric power generation, public supply, and crop irrigation. These three categories make up 90% of all water use in the contiguous United States.

Illustration showing what happens to the water that falls as precipitation over the continental U.S.
The water cycle of the U.S.

In the lower 48 states, nearly 5,000 billion gallons of water fall in the form of precipitation each day. Most of that water re-enters the atmosphere through evapotranspiration, and about a quarter of our daily water input ends up as streamflow to the Atlantic and Pacific Oceans, Canada or the Gulf of Mexico.

In the lower 48 states, nearly 5,000 billion gallons of water fall in the form of precipitation each day. Most of that water re-enters the atmosphere through evapotranspiration, and about a quarter of our daily water input ends up as streamflow to the Atlantic and Pacific Oceans, Canada or the Gulf of Mexico.

Illustration of a landscape showing typical ways that water is used for public supply, thermoelectric power, and irrigation
Water Use in the U.S. - daily water use

Around 90% of daily water use in the lower 48 United States goes toward crop irrigation, thermoelectric power plants, where freshwater is used in the process of creating energy, and public supply, where water is withdrawn or purchased by a water supplier and delivered to many users. These three uses add up to 224,000 million gallons of freshwater per day.

Around 90% of daily water use in the lower 48 United States goes toward crop irrigation, thermoelectric power plants, where freshwater is used in the process of creating energy, and public supply, where water is withdrawn or purchased by a water supplier and delivered to many users. These three uses add up to 224,000 million gallons of freshwater per day.

Illustrations showing how water moves and is withdrawn in public supply, crop irrigation, and thermoelectric power systems
Consumptive water use

Not all water withdrawals are returned to the local environment. Some water is lost because it is evaporated, transpired, incorporated into products or crops, or otherwise made unavailable for immediate use.

Not all water withdrawals are returned to the local environment. Some water is lost because it is evaporated, transpired, incorporated into products or crops, or otherwise made unavailable for immediate use.

Illustration of geogenic contaminant mobilization
Geogenic contaminant mobilization illustration

Managed aquifer-recharge methods and processes. Managed recharge—which uses water of dissimilar geochemistry from groundwater through infiltration into shallow aquifers or injection into deep aquifers—can alter hydrologic and geochemical aquifer conditions such that arsenic and other geogenic contaminants are mobilized from sediment to aqueous phase.

Managed aquifer-recharge methods and processes. Managed recharge—which uses water of dissimilar geochemistry from groundwater through infiltration into shallow aquifers or injection into deep aquifers—can alter hydrologic and geochemical aquifer conditions such that arsenic and other geogenic contaminants are mobilized from sediment to aqueous phase.

Map showing the distribution of modeled water use by category for each watershed (HUC12) in the lower 48 United States.
Water use map (2020)

Average daily water use for the top 3 water use categories in the lower 48 states: thermoelectric power generation, public supply, and crop irrigation.

Average daily water use for the top 3 water use categories in the lower 48 states: thermoelectric power generation, public supply, and crop irrigation.

Stacked bar chart showing sources of nitrogen by U.S. regions
Sources of Nitrogen across hydrologic regions (percent)

A stacked bar chart showing the relative sources of Nitrogen across hydrologic regions of CONUS (2010-2020). Colors show the percent of total Nitrogen load contributed from agriculture, atmospheric deposition, natural sources, wastewater, and other human sources.

A stacked bar chart showing the relative sources of Nitrogen across hydrologic regions of CONUS (2010-2020). Colors show the percent of total Nitrogen load contributed from agriculture, atmospheric deposition, natural sources, wastewater, and other human sources.

Was this page helpful?