Geologic domains of the Greater Yellowstone Ecosystem
Geologic domains of the Greater Yellowstone EcosystemMap of the geologic domains of the Greater Yellowstone Ecosystem (GYE). Boundaries are approximate.

Official websites use .gov
A .gov website belongs to an official government organization in the United States.
Secure .gov websites use HTTPS
A lock () or https:// means you’ve safely connected to the .gov website. Share sensitive information only on official, secure websites.
Stanley is a Research Geologist with the GMEG Science Center in Bozeman, MT. Since joining the USGS in 2021 as a Mendenhall Research Fellow, Stanley has devoted his career to developing machine learning for geothermal resource assessments and supports critical mineral assessments.
Stanley’s research interests vary from machine learning, geothermal systems, and volcano monitoring to rock mechanics, geochemistry, and geohazards. Stan spent several seasons mapping lithology, geotechnical units, geothermal hazards, and volcanic hazards across several geophysical provinces and has taught these subjects to university students. He also served as a volunteer for the Hawaiian Volcano Observatory and Yellowstone National Park.

Map of the geologic domains of the Greater Yellowstone Ecosystem (GYE). Boundaries are approximate.
Map of the geologic domains of the Greater Yellowstone Ecosystem (GYE). Boundaries are approximate.

Comparison of steep subduction (like that occurring today beneath the Pacific Northwest of the United States) and flat-slab subduction (which led to the formation of the Rocky Mountains a few tens of millions of years ago). Black arrows indicate the relative direction of movement of the oceanic plate.
Comparison of steep subduction (like that occurring today beneath the Pacific Northwest of the United States) and flat-slab subduction (which led to the formation of the Rocky Mountains a few tens of millions of years ago). Black arrows indicate the relative direction of movement of the oceanic plate.
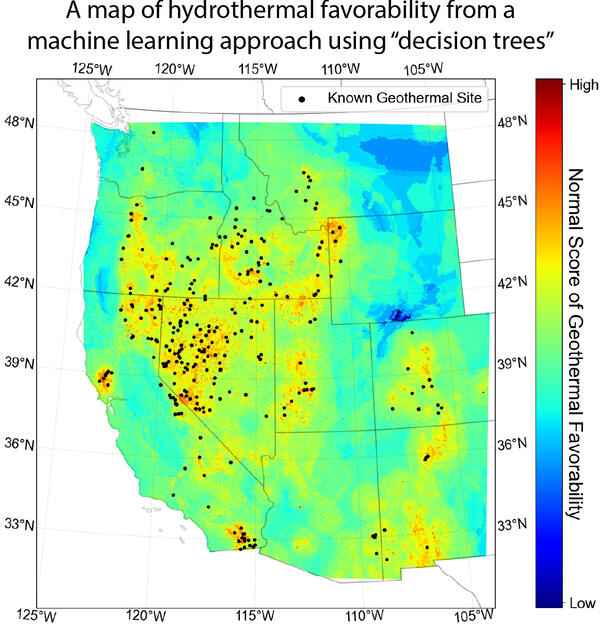
Map of areas predicted as having conditions favorable for fostering a hydrothermal system in the western United States. Black dots are mapped hydrothermal systems. From Mordensky et al., 2023 (https://www.sciencedirect.com/science/article/pii/S0375650523000160).
Map of areas predicted as having conditions favorable for fostering a hydrothermal system in the western United States. Black dots are mapped hydrothermal systems. From Mordensky et al., 2023 (https://www.sciencedirect.com/science/article/pii/S0375650523000160).

A garter snake along Violet Creek near the Mary Mountain Trail in Hayden Valley, Yellowstone National Park. This snake used the geothermally warmed creek to thermoregulate during near-freezing overnight conditions. USGS photo by Stanley Mordensky, June 2023.
A garter snake along Violet Creek near the Mary Mountain Trail in Hayden Valley, Yellowstone National Park. This snake used the geothermally warmed creek to thermoregulate during near-freezing overnight conditions. USGS photo by Stanley Mordensky, June 2023.

View of dead lodgepole pine trees with “bobby socks” from having taken up hydrothermal water that contains dissolved silica and other minerals. Photo taken south of the Fountain Paint Pot Trail in Lower Geyser Basin, Yellowstone National Park, looking toward the southeast. USGS photo by Stanley Mordensky, August 28, 2020.
View of dead lodgepole pine trees with “bobby socks” from having taken up hydrothermal water that contains dissolved silica and other minerals. Photo taken south of the Fountain Paint Pot Trail in Lower Geyser Basin, Yellowstone National Park, looking toward the southeast. USGS photo by Stanley Mordensky, August 28, 2020.

Granite Peak (center) as seen from the north flank of Tempest Mountain. Note: The photographer did not approach this mountain goat. Instead, the mountain goat, which has likely learned to associate human behavior as a source of sodium (a common problem throughout the region), approached the photographer. USGS photo by Stanley Mordensky, August 2020.
Granite Peak (center) as seen from the north flank of Tempest Mountain. Note: The photographer did not approach this mountain goat. Instead, the mountain goat, which has likely learned to associate human behavior as a source of sodium (a common problem throughout the region), approached the photographer. USGS photo by Stanley Mordensky, August 2020.

View of Twin Peaks (left-most prominent peak), Mt. Hague (second-left-most prominent peak), and Mt.
View of Twin Peaks (left-most prominent peak), Mt. Hague (second-left-most prominent peak), and Mt.

Sheep Mountain, in the Gallatin Range, as seen from the north along the Sky Rim Trail near Sunlight Creek (to the left is approximately east, and to the right is approximately west). Note the layered stratigraphy of the sedimentary rocks dipping to the west. USGS photo by Stanley Mordensky, August 2020.
Sheep Mountain, in the Gallatin Range, as seen from the north along the Sky Rim Trail near Sunlight Creek (to the left is approximately east, and to the right is approximately west). Note the layered stratigraphy of the sedimentary rocks dipping to the west. USGS photo by Stanley Mordensky, August 2020.

View of the Cirque of the Towers in the Wind River Range, with Pingora Peak in the center. The Bull Lake and Pinedale glaciations carved this valley by steepening and smoothing its granite walls. Image captured while descending from Texas Pass. Image view is toward the southwest. USGS photo by Stanley Mordensky, August 2019.
View of the Cirque of the Towers in the Wind River Range, with Pingora Peak in the center. The Bull Lake and Pinedale glaciations carved this valley by steepening and smoothing its granite walls. Image captured while descending from Texas Pass. Image view is toward the southwest. USGS photo by Stanley Mordensky, August 2019.
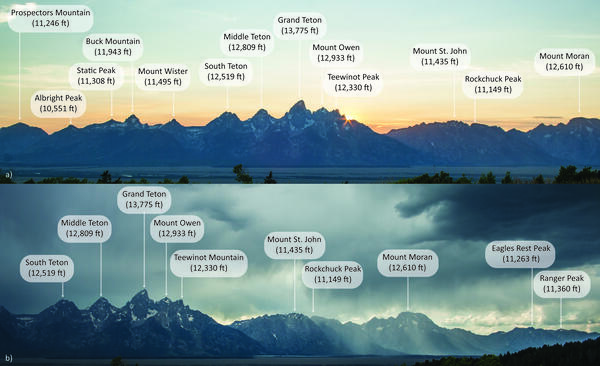
Images of a) the southern Teton Mountains and b) the northern Teton Mountains as seen from the Bridger-Teton National Forest. USGS photos by Stanley Mordensky, August 2014.
Images of a) the southern Teton Mountains and b) the northern Teton Mountains as seen from the Bridger-Teton National Forest. USGS photos by Stanley Mordensky, August 2014.

Simplified geologic map detailing locations of volcanics at Sepulcher Mountain and igneous intrusion at Electric Peak and surrounding area. This map is Fig. 2.
Simplified geologic map detailing locations of volcanics at Sepulcher Mountain and igneous intrusion at Electric Peak and surrounding area. This map is Fig. 2.
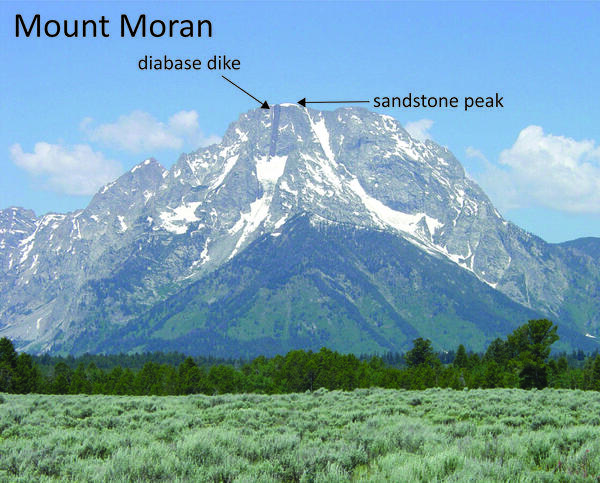
Image of the western face of Mount Moran. Note the dark stripe that marks a mafic intrusion (the “diabase dike”) and the vestiges of the Cambrian-aged Flathead Sandstone Formation (about 50 vertical feet in thickness) at the summit.
Image of the western face of Mount Moran. Note the dark stripe that marks a mafic intrusion (the “diabase dike”) and the vestiges of the Cambrian-aged Flathead Sandstone Formation (about 50 vertical feet in thickness) at the summit.

Geologic map of the Wind River Range from Blackstone, 1993 (The Wind River Range, Wyoming: An Overview. Wyoming Geological Association. Jubilee Anniversary Field Conference Guidebook: Wyoming Geology, Past, Present, and Future. Pg. 121-140).
Geologic map of the Wind River Range from Blackstone, 1993 (The Wind River Range, Wyoming: An Overview. Wyoming Geological Association. Jubilee Anniversary Field Conference Guidebook: Wyoming Geology, Past, Present, and Future. Pg. 121-140).
Map of the geologic domains of the Greater Yellowstone Ecosystem (GYE). Boundaries are approximate.
Map of the geologic domains of the Greater Yellowstone Ecosystem (GYE). Boundaries are approximate.
Comparison of steep subduction (like that occurring today beneath the Pacific Northwest of the United States) and flat-slab subduction (which led to the formation of the Rocky Mountains a few tens of millions of years ago). Black arrows indicate the relative direction of movement of the oceanic plate.
Comparison of steep subduction (like that occurring today beneath the Pacific Northwest of the United States) and flat-slab subduction (which led to the formation of the Rocky Mountains a few tens of millions of years ago). Black arrows indicate the relative direction of movement of the oceanic plate.
Map of areas predicted as having conditions favorable for fostering a hydrothermal system in the western United States. Black dots are mapped hydrothermal systems. From Mordensky et al., 2023 (https://www.sciencedirect.com/science/article/pii/S0375650523000160).
Map of areas predicted as having conditions favorable for fostering a hydrothermal system in the western United States. Black dots are mapped hydrothermal systems. From Mordensky et al., 2023 (https://www.sciencedirect.com/science/article/pii/S0375650523000160).
A garter snake along Violet Creek near the Mary Mountain Trail in Hayden Valley, Yellowstone National Park. This snake used the geothermally warmed creek to thermoregulate during near-freezing overnight conditions. USGS photo by Stanley Mordensky, June 2023.
A garter snake along Violet Creek near the Mary Mountain Trail in Hayden Valley, Yellowstone National Park. This snake used the geothermally warmed creek to thermoregulate during near-freezing overnight conditions. USGS photo by Stanley Mordensky, June 2023.
View of dead lodgepole pine trees with “bobby socks” from having taken up hydrothermal water that contains dissolved silica and other minerals. Photo taken south of the Fountain Paint Pot Trail in Lower Geyser Basin, Yellowstone National Park, looking toward the southeast. USGS photo by Stanley Mordensky, August 28, 2020.
View of dead lodgepole pine trees with “bobby socks” from having taken up hydrothermal water that contains dissolved silica and other minerals. Photo taken south of the Fountain Paint Pot Trail in Lower Geyser Basin, Yellowstone National Park, looking toward the southeast. USGS photo by Stanley Mordensky, August 28, 2020.
Granite Peak (center) as seen from the north flank of Tempest Mountain. Note: The photographer did not approach this mountain goat. Instead, the mountain goat, which has likely learned to associate human behavior as a source of sodium (a common problem throughout the region), approached the photographer. USGS photo by Stanley Mordensky, August 2020.
Granite Peak (center) as seen from the north flank of Tempest Mountain. Note: The photographer did not approach this mountain goat. Instead, the mountain goat, which has likely learned to associate human behavior as a source of sodium (a common problem throughout the region), approached the photographer. USGS photo by Stanley Mordensky, August 2020.
View of Twin Peaks (left-most prominent peak), Mt. Hague (second-left-most prominent peak), and Mt.
View of Twin Peaks (left-most prominent peak), Mt. Hague (second-left-most prominent peak), and Mt.
Sheep Mountain, in the Gallatin Range, as seen from the north along the Sky Rim Trail near Sunlight Creek (to the left is approximately east, and to the right is approximately west). Note the layered stratigraphy of the sedimentary rocks dipping to the west. USGS photo by Stanley Mordensky, August 2020.
Sheep Mountain, in the Gallatin Range, as seen from the north along the Sky Rim Trail near Sunlight Creek (to the left is approximately east, and to the right is approximately west). Note the layered stratigraphy of the sedimentary rocks dipping to the west. USGS photo by Stanley Mordensky, August 2020.
View of the Cirque of the Towers in the Wind River Range, with Pingora Peak in the center. The Bull Lake and Pinedale glaciations carved this valley by steepening and smoothing its granite walls. Image captured while descending from Texas Pass. Image view is toward the southwest. USGS photo by Stanley Mordensky, August 2019.
View of the Cirque of the Towers in the Wind River Range, with Pingora Peak in the center. The Bull Lake and Pinedale glaciations carved this valley by steepening and smoothing its granite walls. Image captured while descending from Texas Pass. Image view is toward the southwest. USGS photo by Stanley Mordensky, August 2019.
Images of a) the southern Teton Mountains and b) the northern Teton Mountains as seen from the Bridger-Teton National Forest. USGS photos by Stanley Mordensky, August 2014.
Images of a) the southern Teton Mountains and b) the northern Teton Mountains as seen from the Bridger-Teton National Forest. USGS photos by Stanley Mordensky, August 2014.
Simplified geologic map detailing locations of volcanics at Sepulcher Mountain and igneous intrusion at Electric Peak and surrounding area. This map is Fig. 2.
Simplified geologic map detailing locations of volcanics at Sepulcher Mountain and igneous intrusion at Electric Peak and surrounding area. This map is Fig. 2.
Image of the western face of Mount Moran. Note the dark stripe that marks a mafic intrusion (the “diabase dike”) and the vestiges of the Cambrian-aged Flathead Sandstone Formation (about 50 vertical feet in thickness) at the summit.
Image of the western face of Mount Moran. Note the dark stripe that marks a mafic intrusion (the “diabase dike”) and the vestiges of the Cambrian-aged Flathead Sandstone Formation (about 50 vertical feet in thickness) at the summit.
Geologic map of the Wind River Range from Blackstone, 1993 (The Wind River Range, Wyoming: An Overview. Wyoming Geological Association. Jubilee Anniversary Field Conference Guidebook: Wyoming Geology, Past, Present, and Future. Pg. 121-140).
Geologic map of the Wind River Range from Blackstone, 1993 (The Wind River Range, Wyoming: An Overview. Wyoming Geological Association. Jubilee Anniversary Field Conference Guidebook: Wyoming Geology, Past, Present, and Future. Pg. 121-140).
*Disclaimer: Listing outside positions with professional scientific organizations on this Staff Profile are for informational purposes only and do not constitute an endorsement of those professional scientific organizations or their activities by the USGS, Department of the Interior, or U.S. Government