Streamgage 04025500 Bois Brule River at Brule, Wisconsin
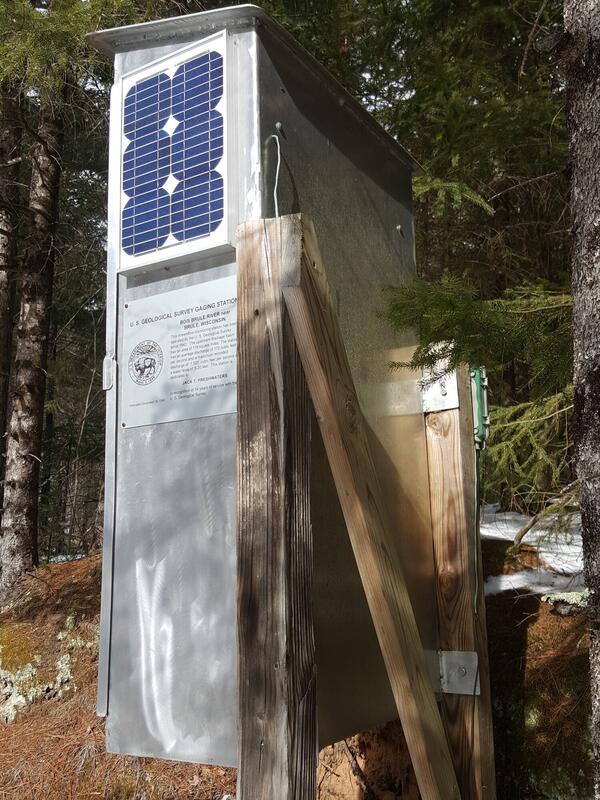
Streamgage 04025500 Bois Brule River at Brule, WisconsinGray metal USGS streamgage housing with solar panel and inscription mounted on a wooden support in a forested area.
Streamgage 04025500 Bois Brule River at Brule, Wisconsin.
https://waterdata.usgs.gov/monitoring-location/USGS-04025500/