
Animated GIF of lava erupting from a fissure at Kīlauea Volcano at night time on December 27, 2020.
Images
Kīlauea images of eruptive activity, field work, and more.
Filter Total Items: 3141
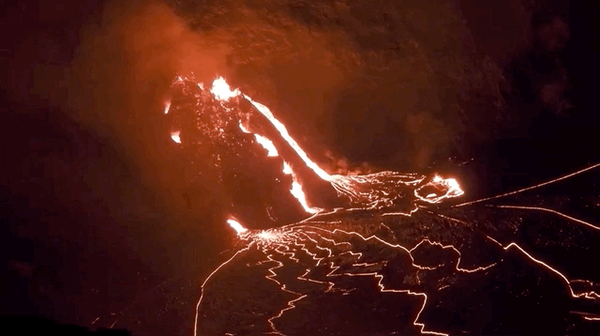
Lava Erupting from a Fissure
Animated GIF of lava erupting from a fissure at Kīlauea Volcano at night time on December 27, 2020.

December 27, 2020—Kīlauea summit eruption contour map
December 27, 2020—Kīlauea summit eruption contour mapThis map of Halema‘uma‘u at Kīlauea's summit shows 20 m (66 ft) contour lines (black) that mark locations of equal elevation above sea level (asl). The map shows that the lava lake (approximate outline marked in red) has filled 177 m (580 ft) of Halema‘uma‘u since the eruption began at approximately 9:30 p.m.

Kīlauea summit eruption - Dec. 27, 2020 at 7:15 a.m. HST
Kīlauea summit eruption - Dec. 27, 2020 at 7:15 a.m. HSTHVO field crews were unable to observe early morning eruption activity in Halema‘uma‘u crater at Kīlauea's summit due to high winds. Upon return to the eruption site this morning, HVO field crews noted the reduced vigor at the western vent. The northern/eastern vent remains inactive. At approximately 7:30 a.m. HST today (Dec.

KW webcam image taken December 27, 2020, just after 6:30 a.m. HST.
KW webcam image taken December 27, 2020, just after 6:30 a.m. HST.Kīlauea summit KW webam image taken on December 27, 2020, just after 6:30 a.m. HST. The eruption in Halemaʻumaʻu continues and this photo shows that activity remains focused at the west vent as of Dec. 27 morning.

Kīlauea summit eruption - Dec. 27, 2020 at 7:15 a.m. HST
Kīlauea summit eruption - Dec. 27, 2020 at 7:15 a.m. HSTThe western vent in Halema‘uma‘u crater wall at Kīlauea summit remains active but field crews monitoring the eruption this morning (December 27) noted that its vigor is somewhat reduced from yesterday. Where three open channels were observed yesterday, there are only two today.
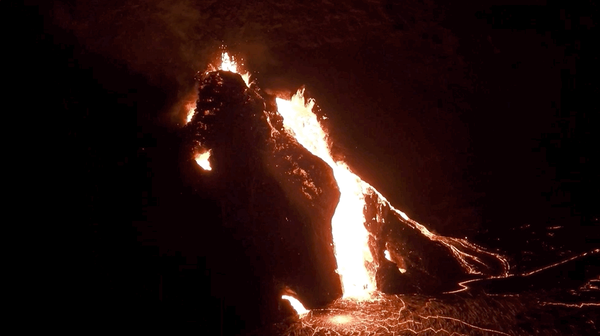
Lava Erupting from a Fissure
Animated GIF of lava erupting from a fissure at Kīlauea Volcano at night time on December 27, 2020.
Animated GIF of lava erupting from a fissure at Kīlauea Volcano at night time on December 27, 2020.
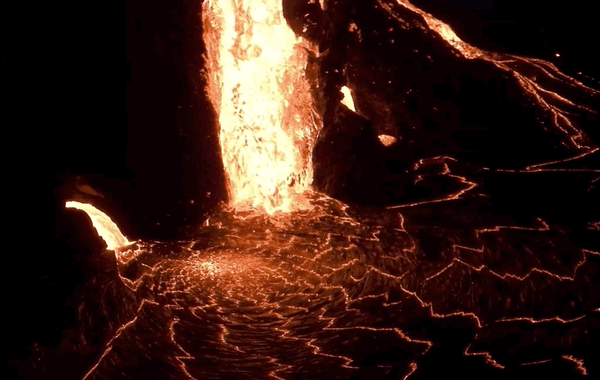
Lava Falls at Kīlauea Volcano (Dec 2020)
An animated GIF of lava falling at the Kīlauea Volcano in Hawaii in 2020 pulled from the Evening Views of the eruption in Halema'uma'u.
An animated GIF of lava falling at the Kīlauea Volcano in Hawaii in 2020 pulled from the Evening Views of the eruption in Halema'uma'u.

New Instrument Measures Lava Lake with Laser
Continuous Laser Rangefinder gauge on crater rim measuring Halema’uma’u lava lake, Kīlauea summit, 12/26/2020. Exploded drawing of instrument optical enclosure upper right. USGS photo and drawing by F. Younger.
Continuous Laser Rangefinder gauge on crater rim measuring Halema’uma’u lava lake, Kīlauea summit, 12/26/2020. Exploded drawing of instrument optical enclosure upper right. USGS photo and drawing by F. Younger.

Kīlauea summit west vent - Dec. 26, 2020 at 5:15 a.m. HST
Kīlauea summit west vent - Dec. 26, 2020 at 5:15 a.m. HSTAs of about 2:40 a.m. HST on December 26, 2020, activity at the west vent in Halema‘uma‘u crater wall at Kīlauea's summit has increased. This photo, taken at approximately 5:15 a.m. HST shows fountaining at the west vent, and lava pouring from the north end of the fissure into the growing lava lake.

Kīlauea summit eruption - Dec. 26, 2020 at 5:15 a.m. HST
Kīlauea summit eruption - Dec. 26, 2020 at 5:15 a.m. HSTThe eruption continues in Halema‘uma‘u crater at Kīlauea's summit. HVO field crews observing the activity overnight noted that at approximately 2:40 a.m. HST December 26, 2020, activity at west vent in the wall of Halema‘uma‘u rejuvenated: the west vent has became more active than the northern vent.

December 26, 2020—Kīlauea summit eruption thermal map
December 26, 2020—Kīlauea summit eruption thermal mapA helicopter overflight yesterday (Dec. 26, 2020) at approximately 9:30 AM HST allowed for aerial visual and thermal imagery to be collected of the new eruption within Halema'uma'u crater at the summit of Kīlauea Volcano. This preliminary thermal map shows that the new lava lake is 790 m (864 yd) E-W axis and 520 m (569 yd) in N-S axis.

Kīlauea summit eruption - Dec. 25, 2020 at 2:30 a.m.
Kīlauea summit eruption - Dec. 25, 2020 at 2:30 a.m.An early December 25, 2020, morning view of the ongoing eruption in Halema‘uma‘u crater at Kīlauea's summit. Overnight fountaining continued to feed the rising lava lake, which slowly fills Halema‘uma‘u. This photo, taken at approximately 2:30 a.m.

Kīlauea's summit lava lake - Dec. 25, 2020 at 7:30 a.m. HST
Kīlauea's summit lava lake - Dec. 25, 2020 at 7:30 a.m. HSTHVO field crews measured Kīlauea's summit lava lake this morning (Dec. 25) around 7:30 a.m. HST. The lake surface is now 445 m (1460 ft) below the crater rim observation site, indicating that the lake has filled 176 m (577 ft) of the bottom of Halema‘uma‘u crater.

Kīlauea summit eruption - Dec. 25, 2020 at 6 p.m. HST
Kīlauea summit eruption - Dec. 25, 2020 at 6 p.m. HSTOn the evening of December 25, 2020, the eruption in Halema‘uma‘u crater at Kīlauea's summit continued. Throughout the day, fountaining at two vents continued to feed the rising lava lake which slowly fills Halema‘uma‘u. This photo, taken at approximately 6 p.m.

December 25, 2020, preliminary map of the lava lake depth at 2:15 p.m.
December 25, 2020, preliminary map of the lava lake depth at 2:15 p.m.Lava lake level measurements collected during a field visit of Kīlauea Volcano's summit around 2:15 p.m. HST on December 25, 2020, were used to create a preliminary lava lake depth map. When compared to pre-eruption topographic models, it shows that the bottom of Halema'uma'u crater has been filled by almost 176 m (578 ft) of lava. Map by H.

KW webcam image taken on December 24, 2020, around 6:30 a.m. HST
KW webcam image taken on December 24, 2020, around 6:30 a.m. HSTKīlauea summit KW webam image taken on December 24, 2020, just after 6:30 a.m. HST. The water lake has been replaced by a lava lake; fissures in the wall of Halemaʻumaʻu feed a lava lake that continues to fill the crater.

Halema‘uma‘u lava lake depth compared to Empire State Building
Halema‘uma‘u lava lake depth compared to Empire State BuildingBeginning on December 20, 2020, fissure vents opened in the Halema‘uma‘u crater. The former water lake quickly boiled away and, fed by two active fissures, the new lava lake is rising. How high is the lava in the approximately 54 acre lake?

Kīlauea summit eruption - December 23, 2020
Scientists continue to monitor the ongoing eruption in Kīlauea Volcano's summit caldera, Island of Hawai‘i. This photo, from the south rim of Halema‘uma‘u crater and looking north, shows the volcanic gas plume heading west. USGS photo by M. Patrick.
Scientists continue to monitor the ongoing eruption in Kīlauea Volcano's summit caldera, Island of Hawai‘i. This photo, from the south rim of Halema‘uma‘u crater and looking north, shows the volcanic gas plume heading west. USGS photo by M. Patrick.

December 23, 2020—Kīlauea summit eruption thermal map constructed from
December 23, 2020—Kīlauea summit eruption thermal map constructed fromA helicopter overflight yesterday (Dec. 23, 2020) at approximately ~10:30 AM HST allowed for aerial visual and thermal imagery to be collected of the new eruption within Halema'uma'u crater at the summit of Kīlauea Volcano. This preliminary thermal map shows that the new lava lake is 715 m (780 yd) E-W axis and 460 m (500 yd) in N-S axis.

Tracking the lava lake in Halema‘uma‘u
Plot showing rise of Kīlauea's summit lava lake since the eruption in Halema‘uma‘u began on December 20 at 9:30 p.m. Since then, laser rangefinder measurements of lava lake surface are made 2–3 times per day. Photos compare the lava lake on the morning of Dec. 21, when it was about 289 ft (87 m) deep, to the evening of Dec. 23 when it was about 511 ft (155 m) deep.
Plot showing rise of Kīlauea's summit lava lake since the eruption in Halema‘uma‘u began on December 20 at 9:30 p.m. Since then, laser rangefinder measurements of lava lake surface are made 2–3 times per day. Photos compare the lava lake on the morning of Dec. 21, when it was about 289 ft (87 m) deep, to the evening of Dec. 23 when it was about 511 ft (155 m) deep.

Monitoring Kīlauea's new summit lava lake
A helicopter overflight yesterday (Dec. 22, 2020) at approximately ~11:30 AM HST allowed for aerial visual and thermal imagery to be collected, which was used to map the area of Kīlauea's growing summit lava lake in Halema‘uma‘u crater. As of yesterday afternoon, the lake is over 690 m (yd) E-W axis and 410 m (yd) in N-S axis.
A helicopter overflight yesterday (Dec. 22, 2020) at approximately ~11:30 AM HST allowed for aerial visual and thermal imagery to be collected, which was used to map the area of Kīlauea's growing summit lava lake in Halema‘uma‘u crater. As of yesterday afternoon, the lake is over 690 m (yd) E-W axis and 410 m (yd) in N-S axis.