January 17, 2025 — Kīlauea summit eruption UAS operations
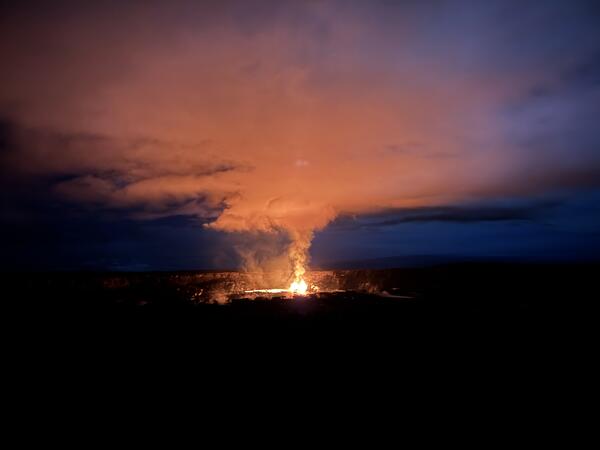
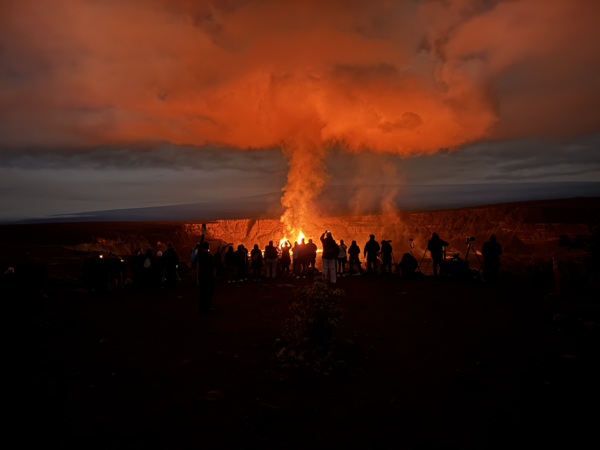
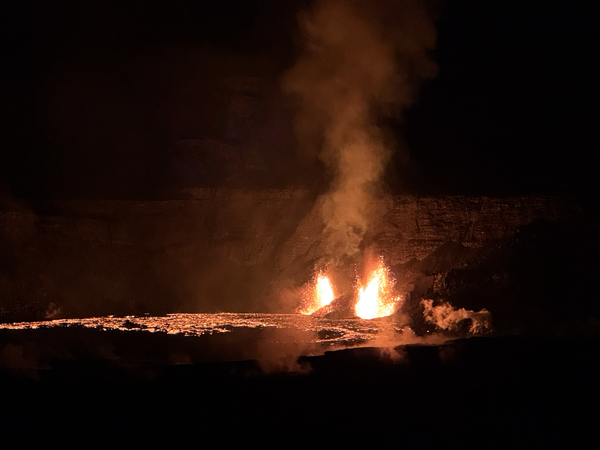
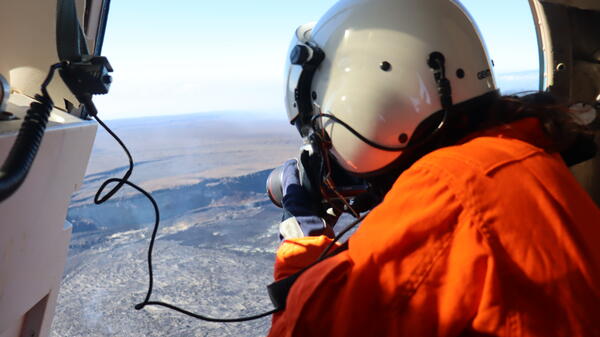
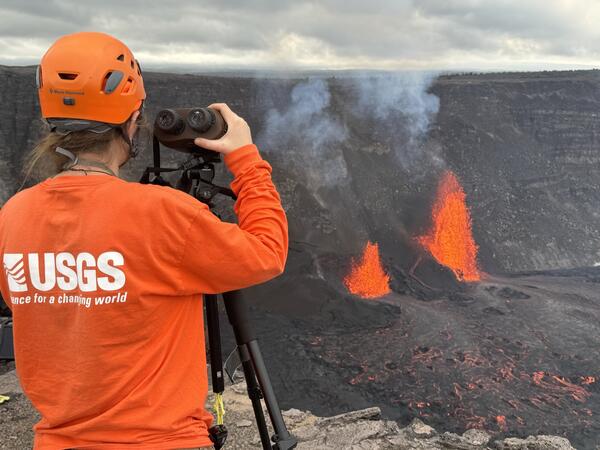
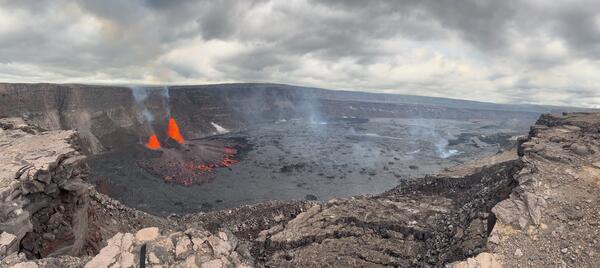
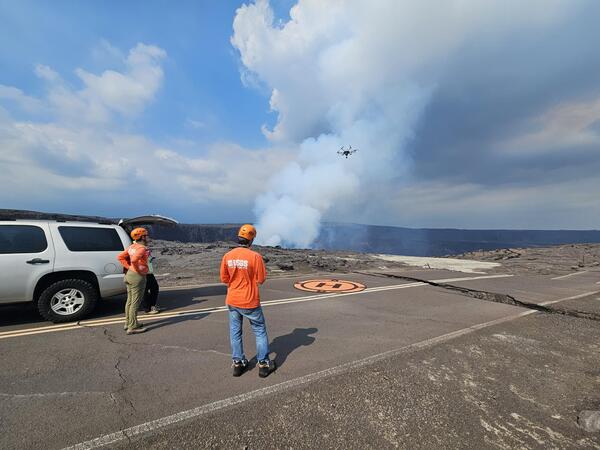
January 17, 2025 — Kīlauea summit eruption UAS operationsWith permission from Hawaiʻi Volcanoes National Park, USGS Hawaiian Volcano Observatory scientists conducted Uncrewed Aerial Systems (UAS) operations at the Kīlauea summit eruption site on January 17, 2025. Scientists conducted flights to assess volcanic gas emissions and take aerial imagery, which will aid in hazard assessment of the ongoing eruption.