U.S. flag

An official website of the United States government

Images

Kīlauea images of eruptive activity, field work, and more.

Filter Total Items: 3135
Color photograph of lidar point cloud and photograph of volcanic cone
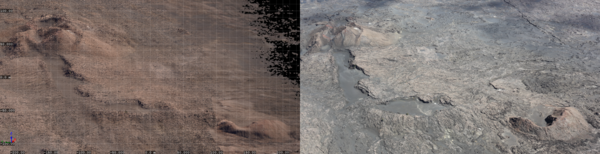
Point cloud and photograph of Pu‘ukoa‘e on Kīlauea

Left: A snapshot of the point cloud from HVO’s September 5, 2024, lidar test flight along Kīlauea’s Southwest Rift Zone, providing an east-looking oblique view of Pu‘ukoa‘e (upper left) and another unnamed cinder cone (lower right).

Left: A snapshot of the point cloud from HVO’s September 5, 2024, lidar test flight along Kīlauea’s Southwest Rift Zone, providing an east-looking oblique view of Pu‘ukoa‘e (upper left) and another unnamed cinder cone (lower right).

Color photograph of scientist measuring crack in road
August 22, 2024 — Measuring cracks on Chain of Craters Road, Kīlauea

USGS Hawaiian Volcano Observatory geologist Mike Cappos takes the bearing of a crack that formed in Chain of Craters Road during a recent intrusive event near Pauahi Crater in Hawai‘i Volcanoes National Park. USGS photo by C. Sealing.

USGS Hawaiian Volcano Observatory geologist Mike Cappos takes the bearing of a crack that formed in Chain of Craters Road during a recent intrusive event near Pauahi Crater in Hawai‘i Volcanoes National Park. USGS photo by C. Sealing.

Color photograph of scientist measuring cracks in road
August 22, 2024 — Measuring cracks on Chain of Craters Road, Kīlauea

USGS Hawaiian Volcano Observatory geologist Mike Cappos measures cracks that formed in Chain of Craters Road during a recent intrusive event near PAUAHI Crater in Hawai‘i Volcanoes National Park. USGS photo by C. Sealing.

USGS Hawaiian Volcano Observatory geologist Mike Cappos measures cracks that formed in Chain of Craters Road during a recent intrusive event near PAUAHI Crater in Hawai‘i Volcanoes National Park. USGS photo by C. Sealing.

Color map showing deformation and earthquakes on volcano
August 22, 2024—InSAR image of ground deformation and map of seismicity for Kīlauea upper East Rift Zone intrusion

The map on the left shows recent deformation at Kīlauea over the timeframe of August 9–21, 2024. Data were acquired by the European Space Agency's Sentinel-1A satellite. Colored fringes denote areas of ground deformation, with more fringes indicating more deformation. Each color cycle represents 2.8 cm (1.1 in) of ground motion.

The map on the left shows recent deformation at Kīlauea over the timeframe of August 9–21, 2024. Data were acquired by the European Space Agency's Sentinel-1A satellite. Colored fringes denote areas of ground deformation, with more fringes indicating more deformation. Each color cycle represents 2.8 cm (1.1 in) of ground motion.

Color photograph of scientist photographing summit caldera of volcano
August 20, 2024 — Routine field visit to Kīlauea summit

USGS scientists made a routine visit to the summit of Kīlauea for maintenance work on a webcam and general observations. The weather offered clear views of Kaluapele (the summit caldera), and only minor outgassing from several spots on the caldera floor. USGS photo by M. Patrick.

USGS scientists made a routine visit to the summit of Kīlauea for maintenance work on a webcam and general observations. The weather offered clear views of Kaluapele (the summit caldera), and only minor outgassing from several spots on the caldera floor. USGS photo by M. Patrick.

Color map showing deformation on volcano
August 19, 2024—InSAR image of Kīlauea ground deformation

This map shows recent deformation at Kīlauea, over the timeframe of August 7-19, 2024. Data were acquired by the European Space Agency's Sentinel-1A satellite. Colored fringes denote areas of ground deformation, with more fringes indicating more deformation.  Each color cycle represents 2.8 cm (1.1 in) of ground motion.

This map shows recent deformation at Kīlauea, over the timeframe of August 7-19, 2024. Data were acquired by the European Space Agency's Sentinel-1A satellite. Colored fringes denote areas of ground deformation, with more fringes indicating more deformation.  Each color cycle represents 2.8 cm (1.1 in) of ground motion.

Color map showing past lava flows from volcanic rift zone
Kīlauea middle East Rift Zone reference map

This reference map depicts the features on Kīlauea's middle East Rift Zone, much of which is within Hawaiʻi Volcanoes National Park. Pit craters and lava flows are evidence of a long history of magma moving along this rift zone pathway. Numerous eruptions took place in this region during the 1960s–1970s.

This reference map depicts the features on Kīlauea's middle East Rift Zone, much of which is within Hawaiʻi Volcanoes National Park. Pit craters and lava flows are evidence of a long history of magma moving along this rift zone pathway. Numerous eruptions took place in this region during the 1960s–1970s.

Color map showing ground deformation on volcano
August 7, 2024—InSAR image of Kīlauea ground deformation

This map shows recent deformation at Kīlauea, over the timeframe of July 26-August 7, 2024. Data were acquired by the European Space Agency's Sentinel-1A satellite. Colored fringes denote areas of ground deformation, with more fringes indicating more deformation.  Each color cycle represents 2.8 cm (1.1 in) of ground motion.

This map shows recent deformation at Kīlauea, over the timeframe of July 26-August 7, 2024. Data were acquired by the European Space Agency's Sentinel-1A satellite. Colored fringes denote areas of ground deformation, with more fringes indicating more deformation.  Each color cycle represents 2.8 cm (1.1 in) of ground motion.

Color photographs of student in lab, in the field, and presenting
2024 HVO PIPES intern Kamalani Poepoe

Left: 2024 HVO PIPES intern Kamalani Poepoe and colleagues prepare samples from Kīlauea’s June 2024 eruption for analysis. Top Right: Kamalani gets instruction on how to perform eruption response tasks on the rim of Halemaʻumaʻu. Lower Right: Kamalani presenting her work at the 2024 PIPES symposium in Honolulu, HI. 

Left: 2024 HVO PIPES intern Kamalani Poepoe and colleagues prepare samples from Kīlauea’s June 2024 eruption for analysis. Top Right: Kamalani gets instruction on how to perform eruption response tasks on the rim of Halemaʻumaʻu. Lower Right: Kamalani presenting her work at the 2024 PIPES symposium in Honolulu, HI. 

Black and white image showing location of volcanoes and infrastructure on an island
Map of volcanoes and infrastructure on the Island of Hawaiʻi

Map of Island of Hawaiʻi, highlighting the four active or potentially active volcanoes of the Island, the number of people living on each volcano based on 2020 census data, major roads (transportation corridors) and minor roads (proxy for population density), when each volcano last erupted, and each volcano’s national threat assessment designation.

Map of Island of Hawaiʻi, highlighting the four active or potentially active volcanoes of the Island, the number of people living on each volcano based on 2020 census data, major roads (transportation corridors) and minor roads (proxy for population density), when each volcano last erupted, and each volcano’s national threat assessment designation.

Color map showing ground deformation and earthquakes at a volcano
July 25, 2024—Kīlauea upper East Rift Zone unrest

This reference map depicts recent unrest along Kīlauea's upper East Rift Zone. Earthquakes that occurred between July 22–25, 2024, are shown as yellow circles. Recent ground deformation in this region, over the timeframe of July 15-24, 2024, is shown as colored fringes; data were recorded by the Italian Space Agency's (ASI) Cosmo-SkyMED satellite.

This reference map depicts recent unrest along Kīlauea's upper East Rift Zone. Earthquakes that occurred between July 22–25, 2024, are shown as yellow circles. Recent ground deformation in this region, over the timeframe of July 15-24, 2024, is shown as colored fringes; data were recorded by the Italian Space Agency's (ASI) Cosmo-SkyMED satellite.

Crack on a road
July 25, 2024 — Crack growth on Chain of Craters Road

On July 25, USGS-Hawaiian Volcano Observatory (HVO) staff again drove down the closed portion of Chain of Craters Road in Hawaiʻi Volcanoes National Park to check for any damage related to the July 22-25 intrusion on Kīlauea's upper East Rift Zone. They found many new small cracks in Chain of Craters Road, including this one, near Hiʻiaka Crater.

On July 25, USGS-Hawaiian Volcano Observatory (HVO) staff again drove down the closed portion of Chain of Craters Road in Hawaiʻi Volcanoes National Park to check for any damage related to the July 22-25 intrusion on Kīlauea's upper East Rift Zone. They found many new small cracks in Chain of Craters Road, including this one, near Hiʻiaka Crater.

Color map showing ground deformation of volcano
July 24, 2024—InSAR image of Kīlauea ground deformation

This map shows recent deformation at Kīlauea, over the timeframe of July 15-24, 2024. Data were recorded by the Italian Space Agency's (ASI) Cosmo-SkyMED satellite. Colored fringes denote areas of ground deformation, with more fringes indicating more deformation.  Each color cycle represents 1.5 cm (0.6 in) of ground motion.

This map shows recent deformation at Kīlauea, over the timeframe of July 15-24, 2024. Data were recorded by the Italian Space Agency's (ASI) Cosmo-SkyMED satellite. Colored fringes denote areas of ground deformation, with more fringes indicating more deformation.  Each color cycle represents 1.5 cm (0.6 in) of ground motion.

Color photograph of scientist standing near road
July 23, 2024 — Small cracks on Chain of Craters Road

On July 23, USGS-Hawaiian Volcano Observatory (HVO) staff drove down the closed portion of Chain of Craters Road in Hawaiʻi Volcanoes National Park to check for any damage related to the July 22-25 intrusion on Kīlauea's upper East Rift Zone.

On July 23, USGS-Hawaiian Volcano Observatory (HVO) staff drove down the closed portion of Chain of Craters Road in Hawaiʻi Volcanoes National Park to check for any damage related to the July 22-25 intrusion on Kīlauea's upper East Rift Zone.

Color photograph of ground deformation at a volcano
July 8, 2024—InSAR image of Kīlauea ground deformation

This map shows recent deformation at Kīlauea, over the timeframe of June 6 to July 8, 2024. Data was recorded by the Italian Space Agency's (ASI) Cosmo-SkyMED satellite. Colored fringes denote areas of ground deformation, with more fringes indicating more deformation.  Each color cycle represents 1.5 cm (0.6 in) of ground motion.

This map shows recent deformation at Kīlauea, over the timeframe of June 6 to July 8, 2024. Data was recorded by the Italian Space Agency's (ASI) Cosmo-SkyMED satellite. Colored fringes denote areas of ground deformation, with more fringes indicating more deformation.  Each color cycle represents 1.5 cm (0.6 in) of ground motion.

Color map showing the location that people reported earthquakes and with color denoting the intensity of shaking
The CIIM for the magnitude-4.1 earthquake on July 6, 2024, on the Island of Hawaiʻi

The Community Internet Intensity Map for the magnitude-4.1 earthquake on July 6, 2024, on the Island of Hawaiʻi (location shown by star). Felt reports show the intensity of shaking during the earthquake across the Island of Hawaiʻi. Not shown are felt reports from Maui and Lanaʻi for this event. 

The Community Internet Intensity Map for the magnitude-4.1 earthquake on July 6, 2024, on the Island of Hawaiʻi (location shown by star). Felt reports show the intensity of shaking during the earthquake across the Island of Hawaiʻi. Not shown are felt reports from Maui and Lanaʻi for this event. 

Color photograph of sulfur crystals in ground crack
July 3, 2024 — Sulfur crystals on Kīlauea

A close up view of delicate sulfur crystals in one of the cracks near the June 3 eruption site, on Kīlauea. USGS photo by M. Patrick.

A close up view of delicate sulfur crystals in one of the cracks near the June 3 eruption site, on Kīlauea. USGS photo by M. Patrick.

Color photograph of thermal area on volcano
Puhimau thermal area

View of the broomsedge grass in the Puhimau thermal area on the upper East Rift Zone of Kīlauea. The Puhimau thermal area is apparent on both sides of Chain of Craters Road in Hawaiʻi Volcanoes National Park. USGS image by K. Mulliken. 

View of the broomsedge grass in the Puhimau thermal area on the upper East Rift Zone of Kīlauea. The Puhimau thermal area is apparent on both sides of Chain of Craters Road in Hawaiʻi Volcanoes National Park. USGS image by K. Mulliken. 

Color photograph of ground cracks and sulfur deposits
July 3, 2024 — Ground cracks and sulfur deposits on the Southwest Rift Zone of Kīlauea

While HVO geologists were moving temporary webcams, they revisited the site of the June 3 eruption. This photo looks downrift, with the June 3 pad of lava in the upper right. Extensive cracking uprift of the fissure had weak residual outgassing and vibrant sulfur deposits. USGS photo by M. Patrick.

While HVO geologists were moving temporary webcams, they revisited the site of the June 3 eruption. This photo looks downrift, with the June 3 pad of lava in the upper right. Extensive cracking uprift of the fissure had weak residual outgassing and vibrant sulfur deposits. USGS photo by M. Patrick.

Photo of ground cracks
July 3, 2024 — Kīlauea Southwest Rift Zone ground cracks

Extensive ground cracks are present uprift of the June 3 eruption site on the Southwest Rift Zone of Kīlauea. USGS photo by M. Patrick.

Color photograph of scientist installing webcam
July 3, 2024 — Shifting webcam locations on Kīlauea's Southwest Rift Zone

With permission from Hawaiʻi Volcanoes National Park, a new temporary webcam was installed on Cone Peak, providing a better view of Kīlauea's Southwest Rift Zone. USGS photo by M. Patrick.

Was this page helpful?