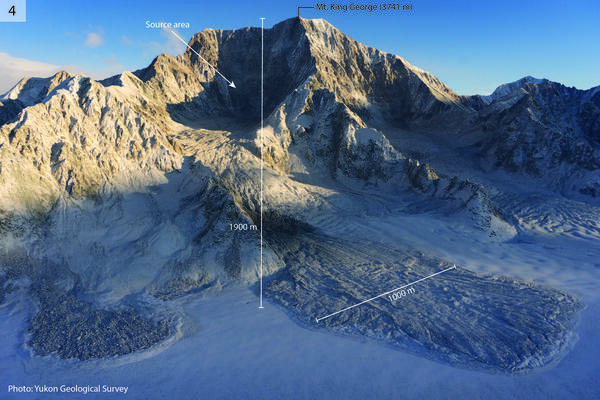
Large landslides on the southwest side of Mt. King George. The main debris lobe on the right is approximately 1000 m wide. The elevation difference between the peak and the glacier is approximately 1900 m. Photo courtesy of Yukon Geological Survey.
Multimedia
The Geologic Hazards Science Center produces many images as part of our earthquake, landslides, geologic, and geomagnetic research. Also, check out our growing educational video selection.
Images
Large landslides on the southwest side of Mt. King George. The main debris lobe on the right is approximately 1000 m wide. The elevation difference between the peak and the glacier is approximately 1900 m. Photo courtesy of Yukon Geological Survey.
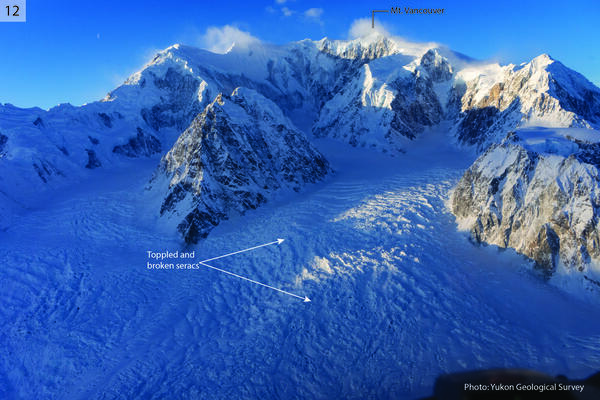
Seracs in an icefall on the east side of Mt. Vancouver (4812 m), toppled by shaking. Field of view is approximately 3.5 km wide. Photo courtesy of Yukon Geological Survey.
Seracs in an icefall on the east side of Mt. Vancouver (4812 m), toppled by shaking. Field of view is approximately 3.5 km wide. Photo courtesy of Yukon Geological Survey.
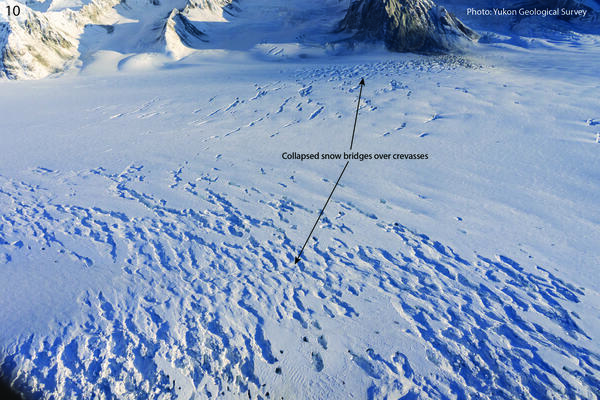
Collapsed snow bridges on crevasse field on the Hubbard Glacier between McArthur Peak and Mt. King George. Photo courtesy of Yukon Geological Survey.
Collapsed snow bridges on crevasse field on the Hubbard Glacier between McArthur Peak and Mt. King George. Photo courtesy of Yukon Geological Survey.
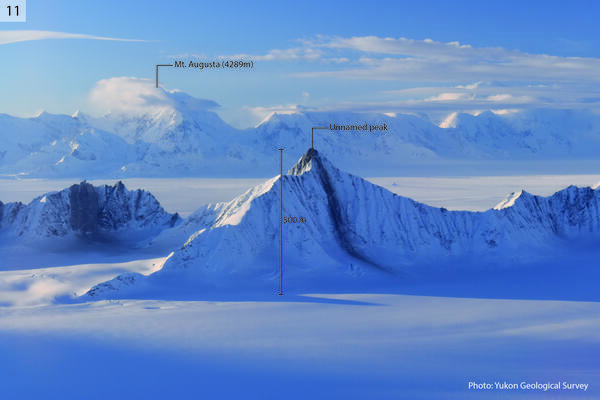
12-12-25 Mt. Vancouver and Mt. Logan Arete Landslides
12-12-25 Mt. Vancouver and Mt. Logan Arete LandslidesCollapsed snow bridges on crevasse field on the Hubbard Glacier between McArthur Peak and Mt. King George. Photo courtesy of Yukon Geological Survey.
12-12-25 Mt. Vancouver and Mt. Logan Arete Landslides
12-12-25 Mt. Vancouver and Mt. Logan Arete LandslidesCollapsed snow bridges on crevasse field on the Hubbard Glacier between McArthur Peak and Mt. King George. Photo courtesy of Yukon Geological Survey.
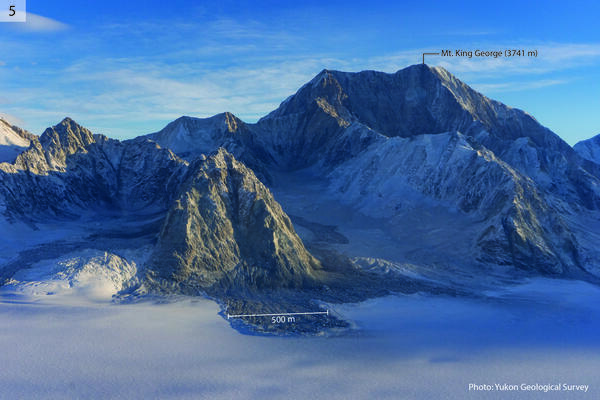
Landslides on the west side of Mt. King George. The central debris lobe is 500 m wide. Photo courtesy of Yukon Geological Survey.
Landslides on the west side of Mt. King George. The central debris lobe is 500 m wide. Photo courtesy of Yukon Geological Survey.
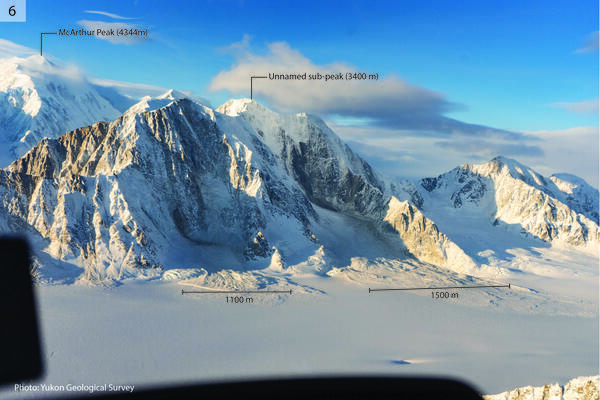
12-12-25 McArthur Peak East Face Landslides & Avalanches
12-12-25 McArthur Peak East Face Landslides & AvalanchesLandslides and avalanches on the east side of McArthur Peak. The left-hand debris lobe is 1100 m wide, and the right-hand debris lobe is 1500 m wide. The elevation difference between the peak and the glacier is approximately 1500 m. Photo courtesy of Yukon Geological Survey.
Videos
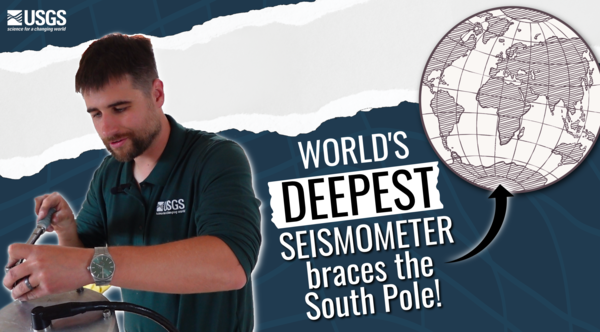
World's deepest seismometer braces the South Pole!
World's deepest seismometer braces the South Pole!Get ready to journey to the bottom of the world! The Deep Ice Seismometer is a groundbreaking new tool that will revolutionize how we monitor earthquakes across the globe. Developed through a powerful collaboration between the U.S.
 a pile of large boulders and tree parts up against a guardrail next to a road
Wildfire often amplifies the likelihood and magnitude of debris flows in steep terrain. In arid climates (e.g. US Mountain West and Southwest), post-fire debris flows typically occur during the first rains following fire, suggesting that rainfall-driven erosion is a strong control on in-channel preconditioning and triggering of these hazards.
Wildfire often amplifies the likelihood and magnitude of debris flows in steep terrain. In arid climates (e.g. US Mountain West and Southwest), post-fire debris flows typically occur during the first rains following fire, suggesting that rainfall-driven erosion is a strong control on in-channel preconditioning and triggering of these hazards.
At the USGS National Earthquake Information Center (NEIC), our team locates and researches earthquakes to provide information on how to reduce risk from earthquakes.
At the USGS National Earthquake Information Center (NEIC), our team locates and researches earthquakes to provide information on how to reduce risk from earthquakes.
At the USGS National Earthquake Information Center (NEIC), our team locates and researches earthquakes to provide information on how to reduce risk from earthquakes.
At the USGS National Earthquake Information Center (NEIC), our team locates and researches earthquakes to provide information on how to reduce risk from earthquakes.
 Thumbnail image of submitted "Meet the USGS Interns: Earthquakes Edition" video
Ever wonder what it is like to work as a USGS intern? Dive into these intern stories of how students are making science their superpower while studying earthquakes!
Ever wonder what it is like to work as a USGS intern? Dive into these intern stories of how students are making science their superpower while studying earthquakes!
Every 11 years the Sun's magnetic field flips. This period is referred to as a solar cycle. As we approach the peak of Solar Cycle 25, activity on the Sun’s surface will increase, including more solar flares, sunspots, and coronal mass ejections.
Every 11 years the Sun's magnetic field flips. This period is referred to as a solar cycle. As we approach the peak of Solar Cycle 25, activity on the Sun’s surface will increase, including more solar flares, sunspots, and coronal mass ejections.


