
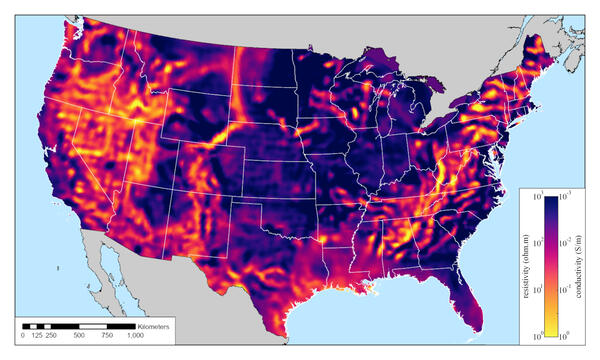
Electrical resistivity at lower-crustal depths (35 km) beneath the contiguous U.S. The architecture of the nation is revealed at this depth with warm colors marking active extension beneath the western U.S.
Images
Geologic Hazards Science Center images.
Filter Total Items: 275
CONUS Electrical resistivity at 35km
Electrical resistivity at lower-crustal depths (35 km) beneath the contiguous U.S. The architecture of the nation is revealed at this depth with warm colors marking active extension beneath the western U.S.
IMG_4954.jpg
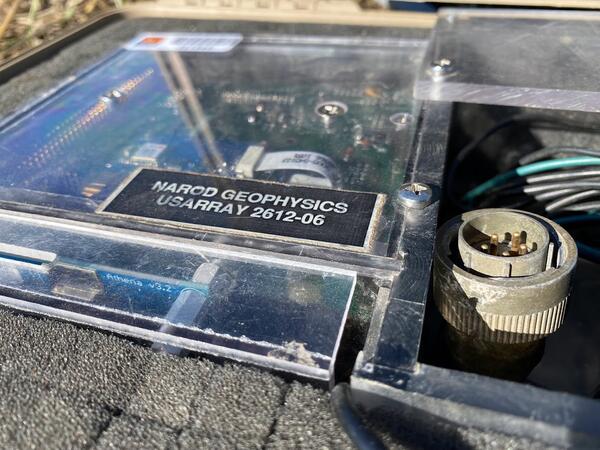
A well-traveled data logger used over the course of the USMTArray. Custom MT instruments purchased at the start of the USMTArray supported the 18 year effort.
A well-traveled data logger used over the course of the USMTArray. Custom MT instruments purchased at the start of the USMTArray supported the 18 year effort.
Collapsed natural arch of Punta Ventana, Guayanilla, Puerto Rico
Collapsed natural arch of Punta Ventana, Guayanilla, Puerto RicoThe starting view is from January, 1970, a field photo of Punta Ventana (“Window Point”) at Guayanilla, Puerto Rico (Monroe, 1980). The image fades to the March 5, 2020 color photo of the same location (ten Brink, 2020). The natural arch had collapsed from earthquake shaking on January 6, 2020 during the 2020 Southwest Puerto Rico Earthquake Sequence.
12-12-25 Hubbard Glacier Collapsed Snow Bridges
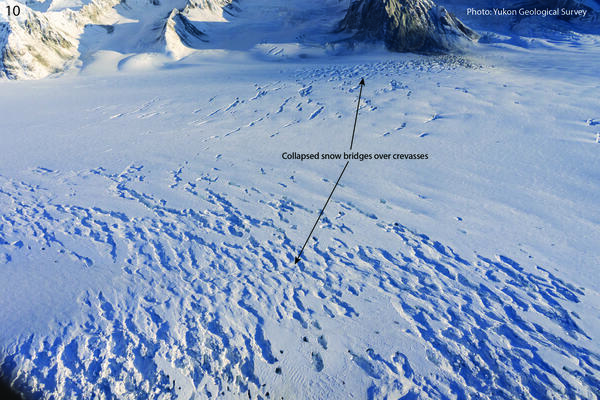
Collapsed snow bridges on crevasse field on the Hubbard Glacier between McArthur Peak and Mt. King George. Photo courtesy of Yukon Geological Survey.
Collapsed snow bridges on crevasse field on the Hubbard Glacier between McArthur Peak and Mt. King George. Photo courtesy of Yukon Geological Survey.
12-12-25 Mt. Vancouver and Mt. Logan Arete Landslides
12-12-25 Mt. Vancouver and Mt. Logan Arete LandslidesCollapsed snow bridges on crevasse field on the Hubbard Glacier between McArthur Peak and Mt. King George. Photo courtesy of Yukon Geological Survey.
12-12-25 Mt. Vancouver and Mt. Logan Arete Landslides
12-12-25 Mt. Vancouver and Mt. Logan Arete LandslidesCollapsed snow bridges on crevasse field on the Hubbard Glacier between McArthur Peak and Mt. King George. Photo courtesy of Yukon Geological Survey.
12-12-25 Mt. King George East Face Landslide
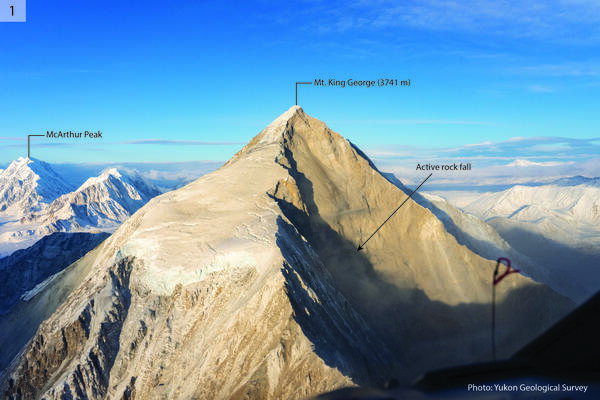
Recent landslide on the east face of Mt. King George (3741 m) with clouds of dust from ongoing rockfall. Debris descended over 1500 m to the glacier below. Photo courtesy of Yukon Geological Survey.
Recent landslide on the east face of Mt. King George (3741 m) with clouds of dust from ongoing rockfall. Debris descended over 1500 m to the glacier below. Photo courtesy of Yukon Geological Survey.
12-12-25 Mt. King George Landslide with Large Runout
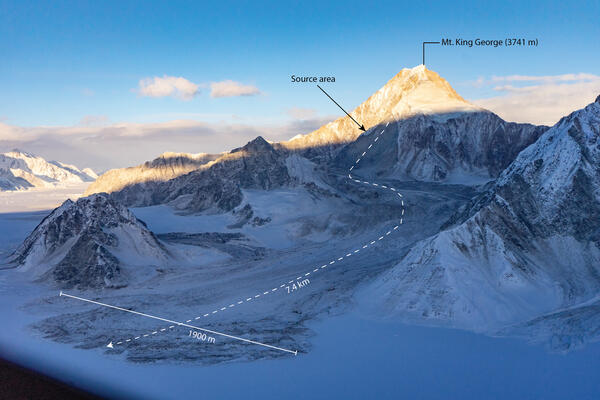
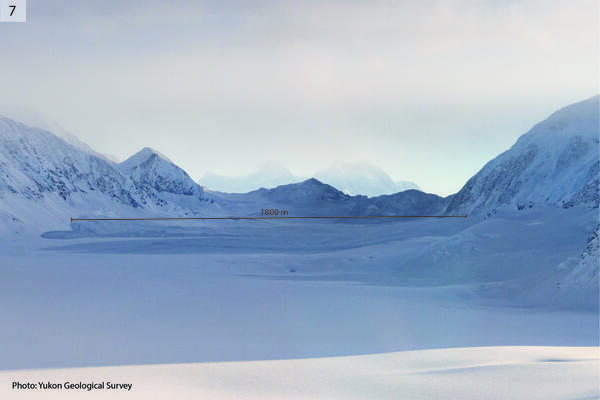
12-12-25 Mt. King George Landslide with Large RunoutLarge landslide on the southwest side of Mt. King George. The main debris lobe is 1800 m wide, and material would have travelled approximately 6 km from the source area (triangular scar) in the background. Photo courtesy of Yukon Geological Survey.
12-12-25 Mt. King George Landslide with Large Runout
12-12-25 Mt. King George Landslide with Large RunoutLarge landslide on the southwest side of Mt. King George. The main debris lobe is 1800 m wide, and material would have travelled approximately 6 km from the source area (triangular scar) in the background. Photo courtesy of Yukon Geological Survey.
12-12-25 Mt. King George East Glacier Landslides
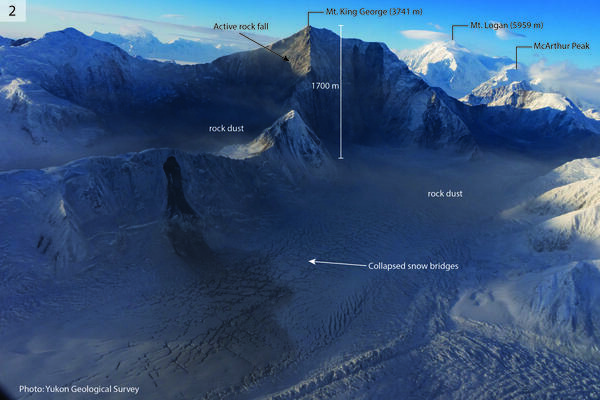
Landslides on the northeast side of Mt. King George with clouds of rock dust in the air caused by ongoing activity. Elevation difference between the peak and the glacier is at least 1700 m. Also note the numerous collapsed snow bridges on the glacier. Photo courtesy of Yukon Geological Survey.
Landslides on the northeast side of Mt. King George with clouds of rock dust in the air caused by ongoing activity. Elevation difference between the peak and the glacier is at least 1700 m. Also note the numerous collapsed snow bridges on the glacier. Photo courtesy of Yukon Geological Survey.
12-12-25 Mt. King George West Face Landslides
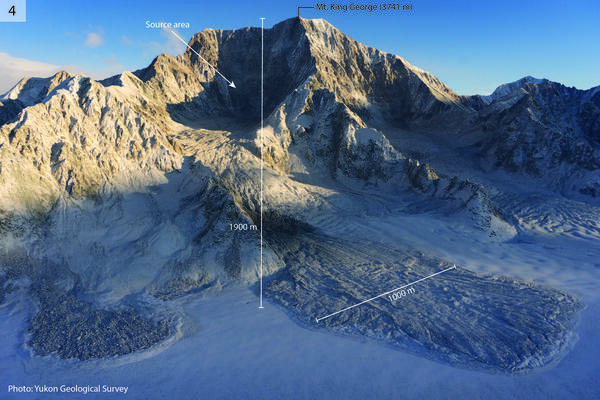
Large landslides on the southwest side of Mt. King George. The main debris lobe on the right is approximately 1000 m wide. The elevation difference between the peak and the glacier is approximately 1900 m. Photo courtesy of Yukon Geological Survey.
Large landslides on the southwest side of Mt. King George. The main debris lobe on the right is approximately 1000 m wide. The elevation difference between the peak and the glacier is approximately 1900 m. Photo courtesy of Yukon Geological Survey.
12-12-25 Mt. Vancouver Toppled Seracs
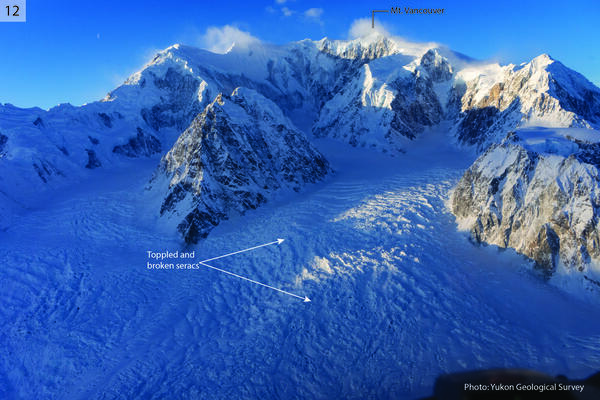
Seracs in an icefall on the east side of Mt. Vancouver (4812 m), toppled by shaking. Field of view is approximately 3.5 km wide. Photo courtesy of Yukon Geological Survey.
Seracs in an icefall on the east side of Mt. Vancouver (4812 m), toppled by shaking. Field of view is approximately 3.5 km wide. Photo courtesy of Yukon Geological Survey.
12-12-25 Mt. King George West Face Landslides
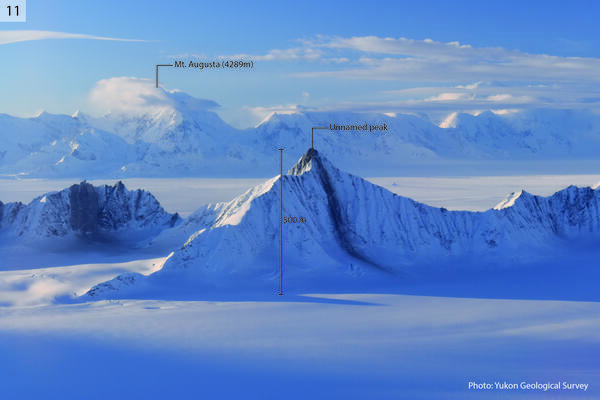
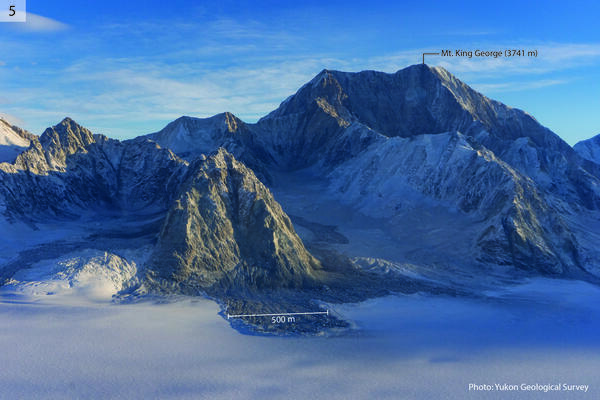
Landslides on the west side of Mt. King George. The central debris lobe is 500 m wide. Photo courtesy of Yukon Geological Survey.
Landslides on the west side of Mt. King George. The central debris lobe is 500 m wide. Photo courtesy of Yukon Geological Survey.
12-12-25 McArthur Peak East Face Landslides & Avalanches
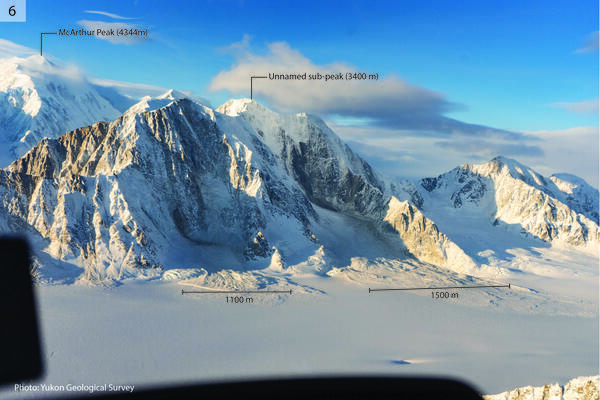
12-12-25 McArthur Peak East Face Landslides & AvalanchesLandslides and avalanches on the east side of McArthur Peak. The left-hand debris lobe is 1100 m wide, and the right-hand debris lobe is 1500 m wide. The elevation difference between the peak and the glacier is approximately 1500 m. Photo courtesy of Yukon Geological Survey.
12-12-25 McArthur Peak East Face Landslides & Avalanches
12-12-25 McArthur Peak East Face Landslides & AvalanchesLandslides and avalanches on the east side of McArthur Peak. The left-hand debris lobe is 1100 m wide, and the right-hand debris lobe is 1500 m wide. The elevation difference between the peak and the glacier is approximately 1500 m. Photo courtesy of Yukon Geological Survey.
12-12-25 Mt. King George North Snow Avalanches
Snow avalanche on the north side of Mt. King George. The debris lobe is 1800 m long and runs up onto the hillside across the valley. Photo courtesy of Yukon Geological Survey.
Snow avalanche on the north side of Mt. King George. The debris lobe is 1800 m long and runs up onto the hillside across the valley. Photo courtesy of Yukon Geological Survey.
12-12-25 McArthur Valley Snow Avalanches
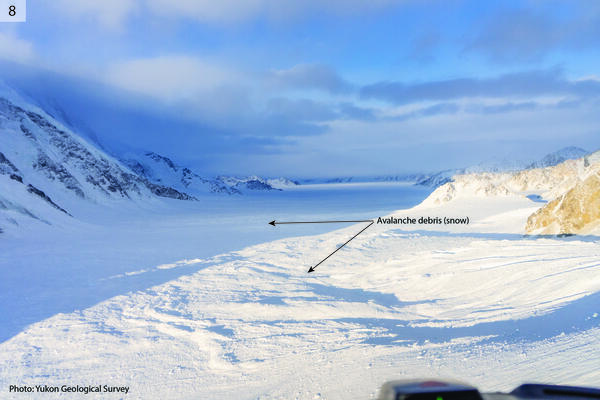
Snow avalanches in the valley on the east side of McArthur Peak. Photo courtesy of Yukon Geological Survey.
Snow avalanches in the valley on the east side of McArthur Peak. Photo courtesy of Yukon Geological Survey.
12-12-25 McArthur Peak Snow Avalanche
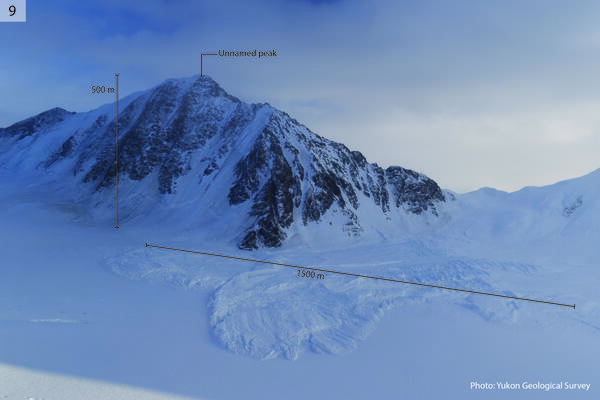
Large snow avalanche in valley east of McArthur Peak. Debris lobe is 1500 m wide. Photo courtesy of Yukon Geological Survey.
Large snow avalanche in valley east of McArthur Peak. Debris lobe is 1500 m wide. Photo courtesy of Yukon Geological Survey.
2025 M7.0 Hubbard Glacier Earthquake-Triggered Landslides and Snow Avalanches Satellite Imagery
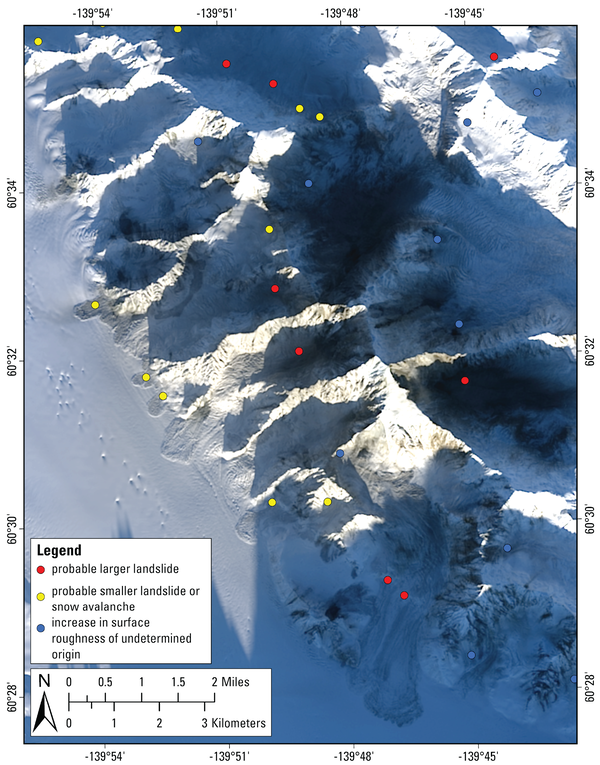
2025 M7.0 Hubbard Glacier Earthquake-Triggered Landslides and Snow Avalanches Satellite ImageryLandsat 9 true color, pan-sharpened satellite image collected on December 10, 2025, showing landslides triggered by the M7.0 Hubbard Glacier Earthquake on the slopes of Mount King George. Landslide points were mapped from SAR change detection.
2025 M7.0 Hubbard Glacier Earthquake-Triggered Landslides and Snow Avalanches Satellite Imagery
2025 M7.0 Hubbard Glacier Earthquake-Triggered Landslides and Snow Avalanches Satellite ImageryLandsat 9 true color, pan-sharpened satellite image collected on December 10, 2025, showing landslides triggered by the M7.0 Hubbard Glacier Earthquake on the slopes of Mount King George. Landslide points were mapped from SAR change detection.
12-11-25 Satellite Imagery of Surface Roughness at Hubbard Glacier
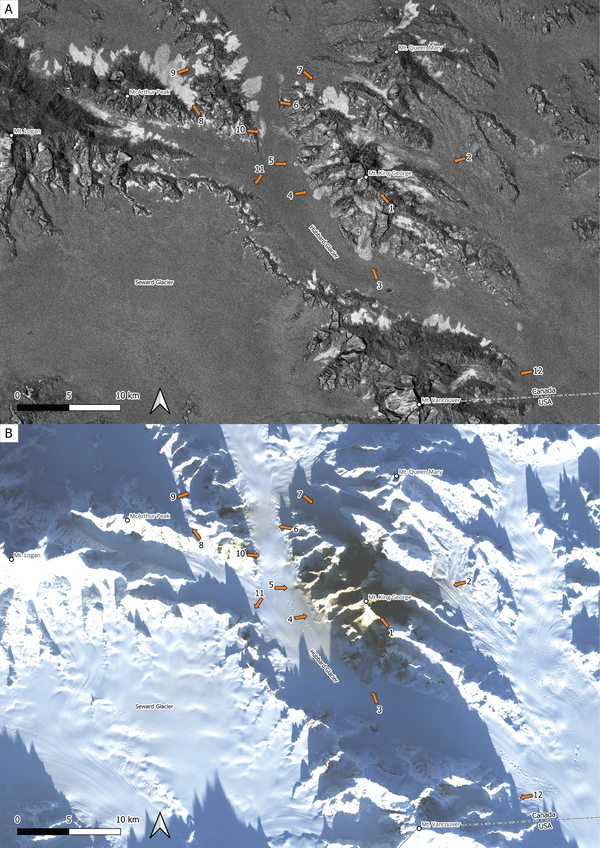
12-11-25 Satellite Imagery of Surface Roughness at Hubbard GlacierA) Map of Sentinel-1 radar surface roughness change with photo locations and azimuths. B) Landsat 8 optical imagery from December 11, 2025, with photo locations and azimuths.
12-11-25 Satellite Imagery of Surface Roughness at Hubbard Glacier
12-11-25 Satellite Imagery of Surface Roughness at Hubbard GlacierA) Map of Sentinel-1 radar surface roughness change with photo locations and azimuths. B) Landsat 8 optical imagery from December 11, 2025, with photo locations and azimuths.
2025 M7.0 Hubbard Glacier Earthquake-Triggered Landslides and Snow Avalanches Satellite Imagery GIF
2025 M7.0 Hubbard Glacier Earthquake-Triggered Landslides and Snow Avalanches Satellite Imagery GIFAnimation of Sentinel-1 radar backscatter satellite imagery from November 28th and December 9th, 2025, showing the changes in surface roughness after the M7.0 Hubbard Glacier Earthquake. The lighter regions have rougher surface areas. The colored points correspond to preliminary mapping of potential mass movements.
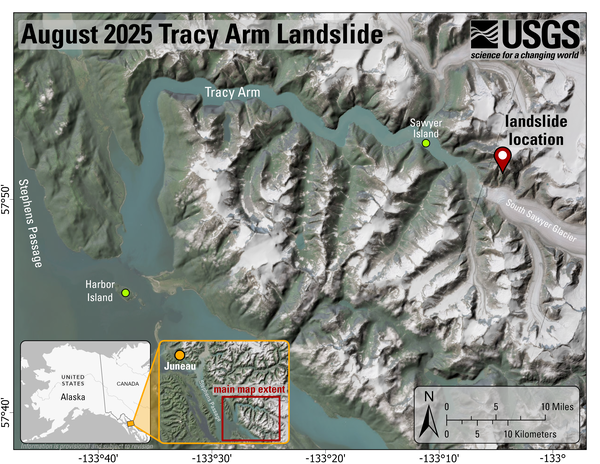
2025 Tracy Arm Landslide Overview Map
Overview map and location of the Tracy Arm landslide-generated tsunami event. The imagery is not current, and the South Sawyer Glacier has retreated over a kilometer from what is depicted.
Overview map and location of the Tracy Arm landslide-generated tsunami event. The imagery is not current, and the South Sawyer Glacier has retreated over a kilometer from what is depicted.
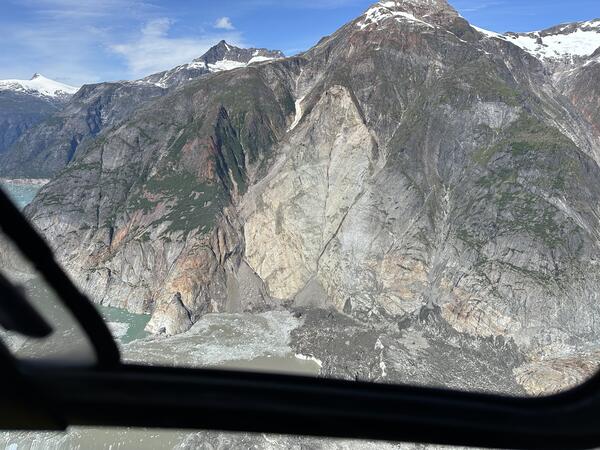
2025 Tracy Arm Landslide Source Area
Oblique aerial photo of the August 10, 2025 landslide source area captured during a field reconnaissance overflight on August 13, 2025. Look direction is approximately north.
Oblique aerial photo of the August 10, 2025 landslide source area captured during a field reconnaissance overflight on August 13, 2025. Look direction is approximately north.
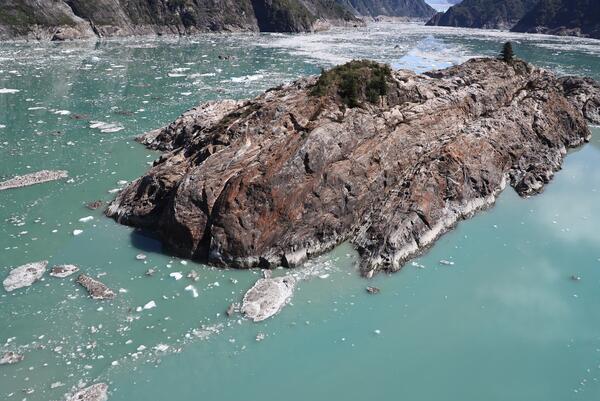
Sawyer Island after 2025 Tracy Arm Landslide
Oblique aerial photo of Sawyer Island captured during a field reconnaissance overflight on August 13, 2025. Look direction is to the southeast.
Oblique aerial photo of Sawyer Island captured during a field reconnaissance overflight on August 13, 2025. Look direction is to the southeast.