
Oblique aerial photo of the August 10, 2025 landslide. Look direction is to the south.
Images
Geologic Hazards Science Center images.
Filter Total Items: 273
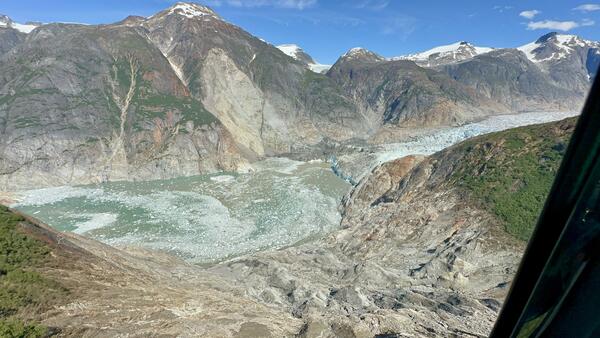
2025 Tracy Arm Landslide Facing South
Oblique aerial photo of the August 10, 2025 landslide. Look direction is to the south.
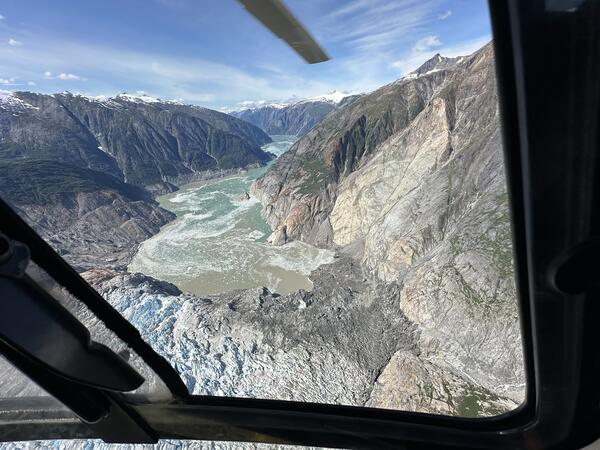
2025 Tracy Arm Landslide and South Sawyer Glacier Facing the Southeast
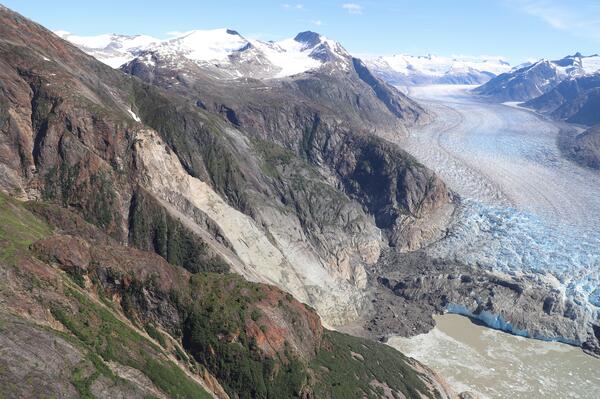
2025 Tracy Arm Landslide and South Sawyer Glacier Facing the SoutheastOblique aerial photo of the August 10, 2025 landslide and South Sawyer Glacier captured during a field reconnaissance overflight on August 13, 2025. Look direction is to the southeast.
2025 Tracy Arm Landslide and South Sawyer Glacier Facing the Southeast
2025 Tracy Arm Landslide and South Sawyer Glacier Facing the SoutheastOblique aerial photo of the August 10, 2025 landslide and South Sawyer Glacier captured during a field reconnaissance overflight on August 13, 2025. Look direction is to the southeast.
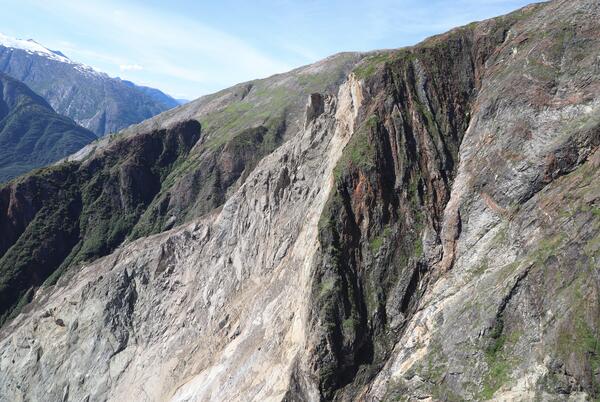
2025 Tracy Arm Landslide and Tsunami Trimline
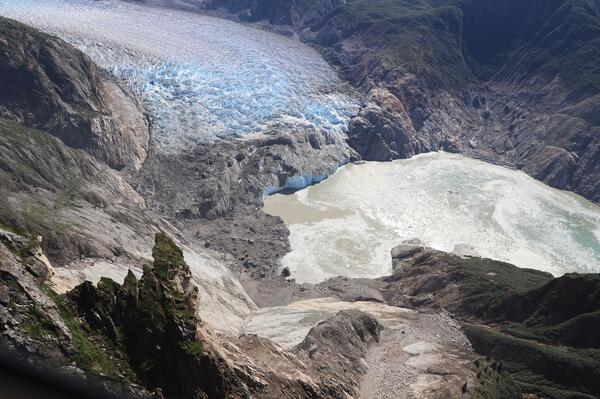
Oblique aerial photo of the August 10, 2025 landslide source area captured during a field reconnaissance overflight on August 13, 2025. Look direction is approximately north.
Oblique aerial photo of the August 10, 2025 landslide source area captured during a field reconnaissance overflight on August 13, 2025. Look direction is approximately north.
2025 Tracy Arm Landslide Before and After Satellite Imagery
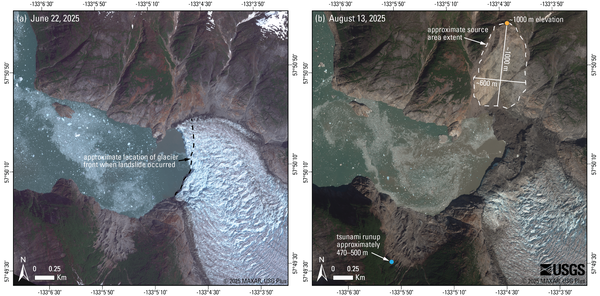
2025 Tracy Arm Landslide Before and After Satellite ImageryComparison of (a) pre- and (b) post-event satellite images showing the source area of the August 10th landslide that impacted Tracy Arm. The dashed line in (a) shows the approximate location of the front of South Sawyer Glacier on August 7th, 2025 (mapped from imagery © 2025 Planet Labs PBC).
2025 Tracy Arm Landslide Before and After Satellite Imagery
2025 Tracy Arm Landslide Before and After Satellite ImageryComparison of (a) pre- and (b) post-event satellite images showing the source area of the August 10th landslide that impacted Tracy Arm. The dashed line in (a) shows the approximate location of the front of South Sawyer Glacier on August 7th, 2025 (mapped from imagery © 2025 Planet Labs PBC).
2025 Tracy Arm Landslide Across the Fiord Facing North
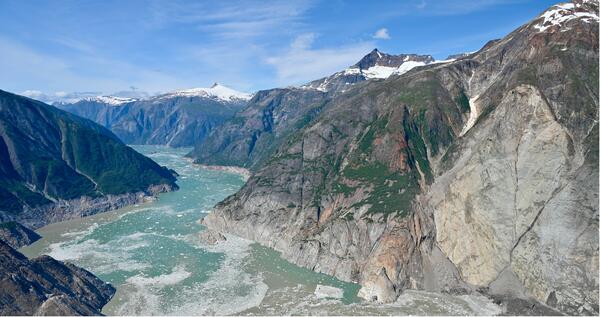
2025 Tracy Arm Landslide Across the Fiord Facing NorthOblique aerial photo of the August 10, 2025 landslide taken from across the fiord during a field reconnaissance overflight on August 13, 2025. Look direction is approximately north.
2025 Tracy Arm Landslide Across the Fiord Facing North
2025 Tracy Arm Landslide Across the Fiord Facing NorthOblique aerial photo of the August 10, 2025 landslide taken from across the fiord during a field reconnaissance overflight on August 13, 2025. Look direction is approximately north.
2025 Tracy Arm Landslide Aerial Photo Facing West
Oblique aerial photo of the August 10, 2025 landslide captured during a field reconnaissance overflight on August 13, 2025. Look direction is to the west.
Oblique aerial photo of the August 10, 2025 landslide captured during a field reconnaissance overflight on August 13, 2025. Look direction is to the west.
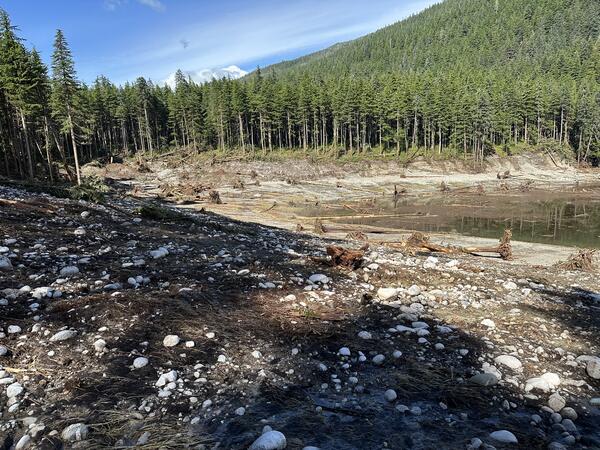
2025 Tracy Arm Landslide Tsunami-Inundated Shoreline
2025 Tracy Arm Landslide Tsunami-Inundated ShorelinePhoto of tsunami-inundated shoreline at Williams Cove, near the mouth of Tracy Arm. Look direction is approximately north.
2025 Tracy Arm Landslide Tsunami-Inundated Shoreline
2025 Tracy Arm Landslide Tsunami-Inundated ShorelinePhoto of tsunami-inundated shoreline at Williams Cove, near the mouth of Tracy Arm. Look direction is approximately north.
2025 Tracy Arm Landslide Headscarp
Oblique aerial photo of the August 10, 2025 landslide headscarp. Look direction is to the northwest.
Oblique aerial photo of the August 10, 2025 landslide headscarp. Look direction is to the northwest.
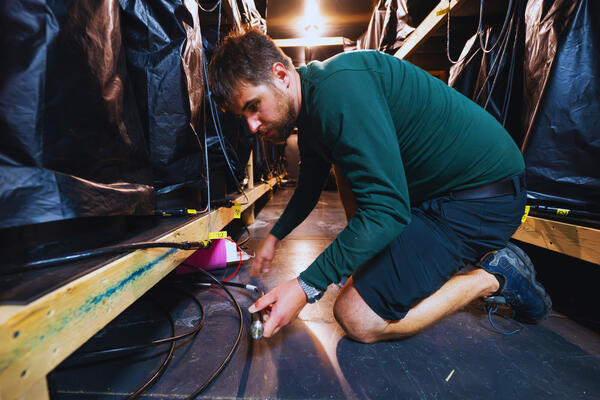
Testing the Deep Ice Seismometer
USGS Rob Anthony sets up equipment in a freezer to test a Seismometer Interface Module at the Physical Sciences Laboratory in Stoughton, Wisconsin on Aug. 7, 2025. (Photo by Taylor Wolfram / UW–Madison)
USGS Rob Anthony sets up equipment in a freezer to test a Seismometer Interface Module at the Physical Sciences Laboratory in Stoughton, Wisconsin on Aug. 7, 2025. (Photo by Taylor Wolfram / UW–Madison)
IceCube 2025-08-07TW 1279
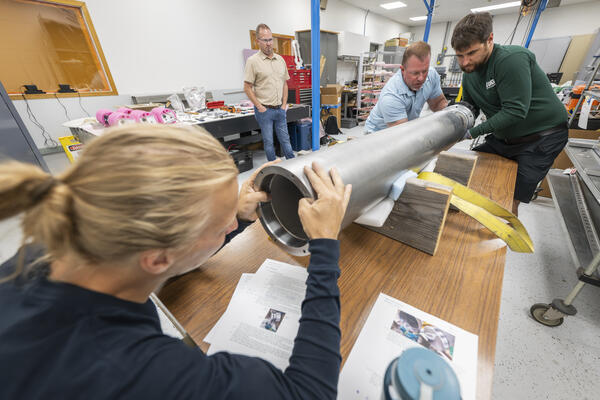
Nicholas Pelyk, Jason Patton, Rob Anthony, and Skyler Grulke slide a part into the tube while assembling a seismometer at the Physical Sciences Laboratory in Stoughton, Wisconsin on Aug. 7, 2025. (Photo by Taylor Wolfram / UW–Madison)
Nicholas Pelyk, Jason Patton, Rob Anthony, and Skyler Grulke slide a part into the tube while assembling a seismometer at the Physical Sciences Laboratory in Stoughton, Wisconsin on Aug. 7, 2025. (Photo by Taylor Wolfram / UW–Madison)

IceCube 2025-08-07TW 0407
Jason Patton, Rob Anthony (USGS), and Skyler Grulke assemble a seismometer at the Physical Sciences Laboratory in Stoughton, Wisconsin on Aug. 7, 2025. (Photo by Taylor Wolfram / UW–Madison)
Jason Patton, Rob Anthony (USGS), and Skyler Grulke assemble a seismometer at the Physical Sciences Laboratory in Stoughton, Wisconsin on Aug. 7, 2025. (Photo by Taylor Wolfram / UW–Madison)
IceCube 2025-08-07TW 0578
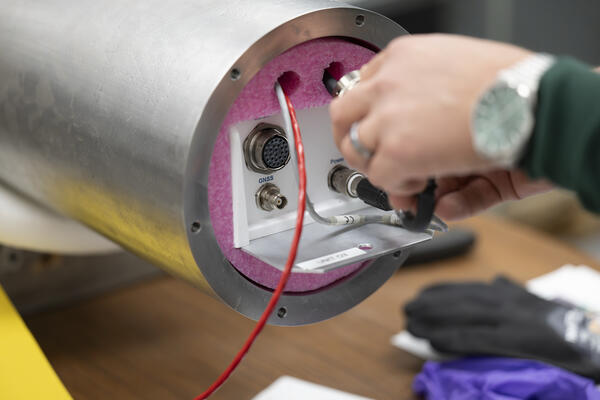
USGS Rob Anthony puts in the Seismometer Interface Module while assembling a seismometer at the Physical Sciences Laboratory in Stoughton, Wisconsin on Aug. 7, 2025. (Photo by Taylor Wolfram / UW–Madison)
USGS Rob Anthony puts in the Seismometer Interface Module while assembling a seismometer at the Physical Sciences Laboratory in Stoughton, Wisconsin on Aug. 7, 2025. (Photo by Taylor Wolfram / UW–Madison)

cir1555_fig04.png
Map of the United States and its territories showing the distribution of average annualized earthquake losses by region (modified from Jaiswal and others, 2023). Economic losses from earthquakes in these nine regions are estimated to average \$14.7 billion dollars per year.
Map of the United States and its territories showing the distribution of average annualized earthquake losses by region (modified from Jaiswal and others, 2023). Economic losses from earthquakes in these nine regions are estimated to average \$14.7 billion dollars per year.

cir1555_fig02.png
Map of the United States and its territories showing 2024 International Building Code Seismic Design Categories and Risk Categories.
Map of the United States and its territories showing 2024 International Building Code Seismic Design Categories and Risk Categories.

AftershockForecastfig6.gif
An example of Bayesian updating of productivity parameter (a-value) for the 2010 Mw 8.8 Maule, Chile, earthquake. Immediately following the earthquake, the SZ-GENERIC region-specific a-value distribution can be used.
An example of Bayesian updating of productivity parameter (a-value) for the 2010 Mw 8.8 Maule, Chile, earthquake. Immediately following the earthquake, the SZ-GENERIC region-specific a-value distribution can be used.

Mendocino_headerinfo-2.jpg
Screenshot of the Aftershock Forecast for an earthquake in California, showing the information box at the top of the forecast and the four tabs of forecast information.
Screenshot of the Aftershock Forecast for an earthquake in California, showing the information box at the top of the forecast and the four tabs of forecast information.
AftershockForecastSequence-SpecificModelParameters.png
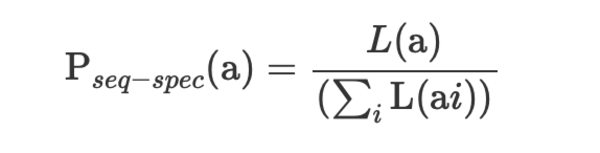
AftershockForecastSequence-SpecificModelParameters.pngAftershock Forecast Sequence-Specific Model Parameters equation
The probability distribution for the number of aftershocks, P(N), and the forecast can then be computed using the same procedures as for the generic model, using Pseq-spec(a) instead of Pgeneric(a).
AftershockForecastSequence-SpecificModelParameters.png
AftershockForecastSequence-SpecificModelParameters.pngAftershock Forecast Sequence-Specific Model Parameters equation
The probability distribution for the number of aftershocks, P(N), and the forecast can then be computed using the same procedures as for the generic model, using Pseq-spec(a) instead of Pgeneric(a).

Mendocino_M41month.jpg
Screenshot of the Aftershock Forecast for an earthquake in California, with the “Summary” tab selected, and “M4+” and “Show All” selections for magnitude and forecast duration.
Screenshot of the Aftershock Forecast for an earthquake in California, with the “Summary” tab selected, and “M4+” and “Show All” selections for magnitude and forecast duration.

Mendocino_table.jpg
Screenshot of the Aftershock Forecast for an earthquake in California, with the “Forecast Table” tab selected.
Screenshot of the Aftershock Forecast for an earthquake in California, with the “Forecast Table” tab selected.

Mendocino_M4all.jpg
Screenshot of the Aftershock Forecast for an earthquake in California, with the “Summary” tab selected, and “M4+” and “Show All” selections for magnitude and forecast duration.
Screenshot of the Aftershock Forecast for an earthquake in California, with the “Summary” tab selected, and “M4+” and “Show All” selections for magnitude and forecast duration.

Aftershock Forecast on the earthquake event page
Screenshot of the Overview webpage for an earthquake in California. The “Aftershock Forecast” card is at lower center.
Screenshot of the Overview webpage for an earthquake in California. The “Aftershock Forecast” card is at lower center.