
Oscillating Flows in the Milwaukee River Estuary
How do Lake Michigan water level variations and seiches affect the Milwaukee River estuary, its harbor, and rivers upstream?
Introduction
In Milwaukee, Wisconsin, Lake Michigan water level fluctuations caused by storm surges, wind, and seiches affect the Inner Harbor of the Milwaukee River estuary and cause relatively quick changes in water levels and river currents over just a few hours.
These changes propagate upstream into the three major tributaries that feed into the Inner Harbor and affect fish habitat, water quality, and water temperature. These rivers are:
- Milwaukee River from the north
- Menomonee River from the west
- Kinnickinnic River from the southwest
Two U.S. Geological Survey streamgages are available with water level and velocity data that show these fluctuations.
- USGS streamgage 04087170 Milwaukee River at Mouth at Milwaukee, WI
- USGS streamgage 04087142 Menomonee River at 16th Street at Milwaukee, WI
The water level data from these gages, along with data from now inactive gages on the Kinnickinnic River at South 1 st Street and the Milwaukee River at East Cherry Street, were used to create animations of the spatial footprint of the inundation associated with high frequency water level fluctuations.
To map inundated areas, horizontal surfaces were generated from the water level data and overlain on top of a digital elevation model that included both topographic (above the water) and bathymetric (below the water) elevation data.
The animations include examples of seiche/storm related water-level fluctuations that occurred between 2019 and 2021 when Lake Michigan water levels were at or near record highs.
The distance that the oscillating effects travel upstream in the tributaries depends on the Lake Michigan's water level, tributary discharge, the wind direction, the height of the oscillation, and how steeply the elevation of the riverbed rises proceeding inland and upstream.
Map of two U.S. Geological Survey active streamgages
Explore the areas around the streamgages in the map by using the zoom button in the upper left corner.
Title
Title
Seiches add to the diversity of estuary habitats
A series of habitat maps for the Milwaukee estuary are available from the University of Wisconsin-Milwaukee and show the rich diversity of fish-related habitats associated with a range of vegetation, substrate and forage.
Some species are resident (commonly in the harbor year-round) and others are transient (move into the harbor periodically).
Frequent water level changes are accentuated around the perimeter of the inner harbor, the banks of the tributaries, and the upstream limit of the surge and seiche oscillation.
This helps add to the diversity of habitat types for plant life as well as invertebrates, algae, fish, and wildfowl. Depending on the annual and seasonal changes in lake-wide water levels, different plant species that depend on specific water depth ranges can flourish or fail. Fish occupy the edges for spawning, refuge, and feeding.
The oscillating water levels bring in nutrients and small organisms that fish like to feed on. Water level fluctuations, winds, tributary floods, and water depth add to variability in summer water temperatures.
Water level oscillations and high lake levels meet in the Inner Harbor
Rapid water level changes in the Great Lakes can be caused by several weather events, including strong winds and changes in atmospheric pressure. Seiches are a particular type of rapid water level change where water sloshes back and forth in an enclosed basin, similar to water sloshing in a bathtub.
All of the Great Lakes experience seiches, but their amplitude (height) and periodicity (time between consecutive highs or consecutive lows) varies depending on basin orientation, basin shape, basin bathymetry, and the weather conditions responsible for generating the seiche. Because seiches may continue long after a storm has passed, they can occur unexpectedly and be particularly hazardous.
Rapid water level changes in Lake Michigan are magnified as they pass into the Milwaukee Inner Harbor and instantaneously cause the upriver water levels to change.
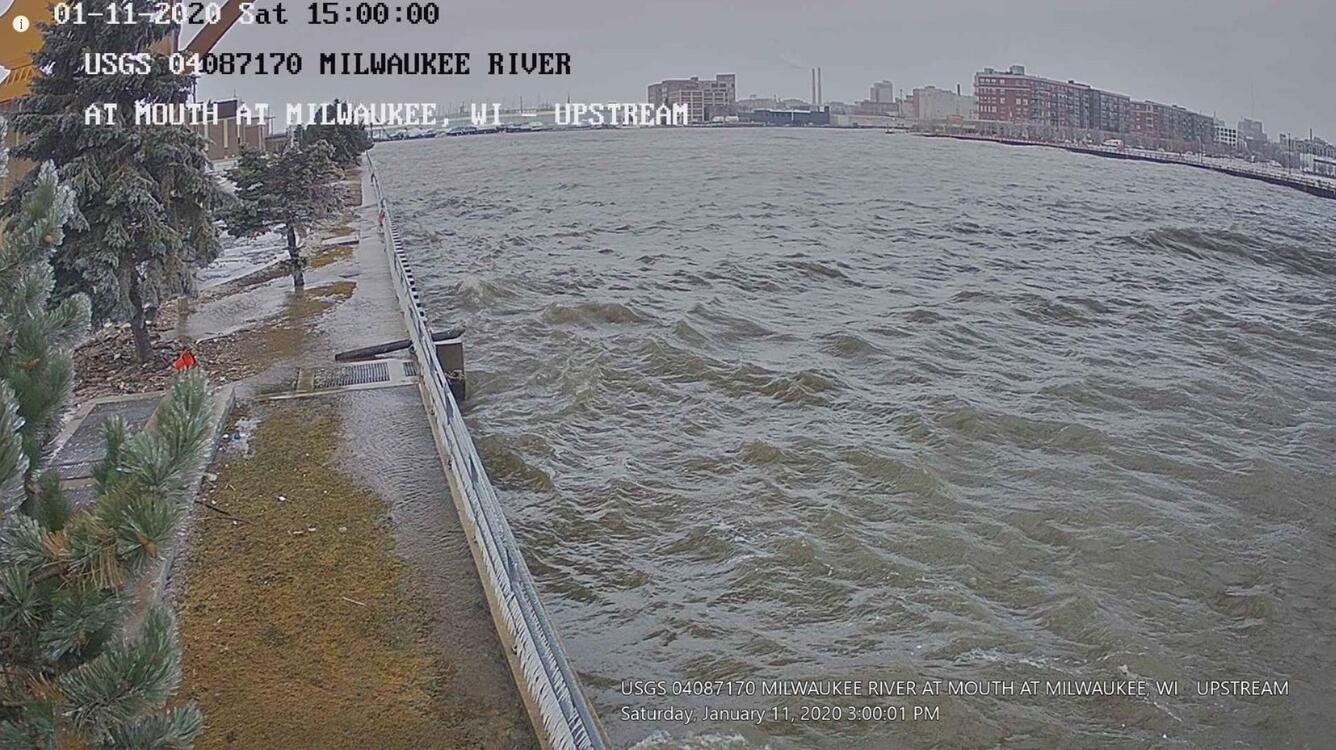
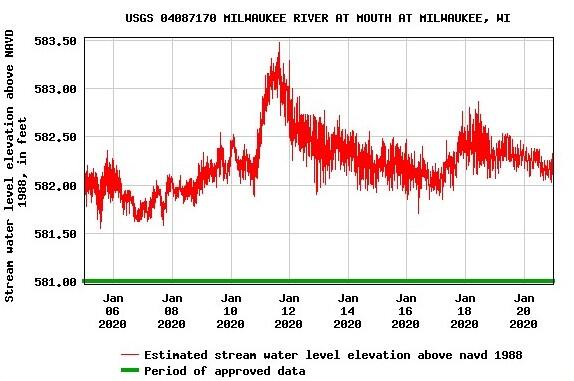
On January 11, 2020, a particularly large storm surge of almost three feet (one meter) happened in the Inner Harbor on top of an already high lake level. That surge allowed wind waves to overtop of the sheet piling walls in the connecting channel between the Outer and Inner harbors near Jones Island.
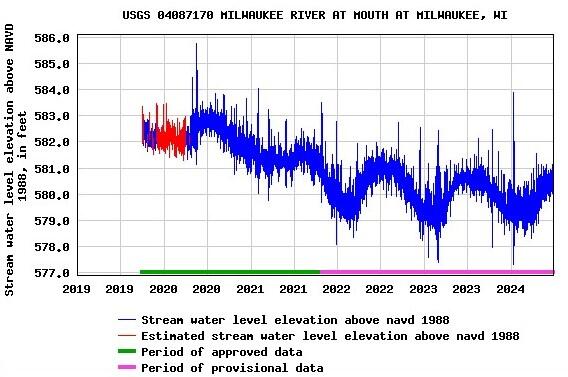
A couple of months later, a large rain event in May 2020 happened during near record lake levels. Water levels are recorded every five minutes at a USGS streamgage at the mouth of the Milwaukee River to monitor these rapid changes.
The National Atmospheric and Oceanic Administration uses the International Great Lakes datum of 1985 (IGLD85) as a base for monitoring water levels on the Great Lakes.
For inland areas, including rivers, the North American Vertical Datum of 1988 (NAVD88) is used. In order to look at how the lake water levels interact with the rivers and the surrounding land, a conversion between IGLD85 and NAVD88 was needed.
The conversion is shown in the table below for Lake Michigan water level statistics, along with the conversion from English feet (ft) to Metric meters (m).
| Lake Michigan | IGLD85 (FT) | NAVD88 (FT) | NAVD88 (M) |
|---|---|---|---|
| Low water datum | 577.5 | 577.65 | 176.07 |
| Ordinary high water mark | 581.5 | 581.65 | 177.29 |
| Long-term average (1918-2023) | 578.87 | 579.02 | 176.49 |
| Record high (June/July 2020) | 582.18 | 582.33 | 177.49 |
| Record low (Jan 2013) | 576.02 | 576.17 | 175.62 |
Over the last 100 years or so, water levels in Lake Michigan have fluctuated by about six feet (two meters). However, record highs and lows happened within the last 15 years, with a monthly record low in January 2013 of 576.02 feet above IGLD 85 (175.62 meters above NAVD 88) and high in June through July of 2020 of 582.18 IGLD 85 (177.49 meters above NAVD 88).
What happens to rapid water level oscillations upstream in the connected rivers?
Water level oscillations extend upstream in rivers differently depending on how quickly the riverbed rises proceeding upstream. The landward margins of the water fluctuations manifest themselves by changing the direction of the river currents.
When the water levels rise the currents reverse and go upstream. When the water levels drop the currents switch and go downstream. At the highest and lowest elevations of the seiche the currents stop altogether for a few seconds before they reverse. The length and location of the river channel affected by these water level oscillations and flow reversals depends on the background lake level in the lake and how steeply the channel bed rises upstream.
Title
Title
Milwaukee River
The upstream limit of seiche impacts on the Milwaukee River is just downstream of the East North Avenue bridge crossing.
The seiche-impacted distance upstream of the old North Avenue Dam / Caesar Park Trail is 90, 210, 250, and 260 meters for a 20-centimeter seiche with a lake level of 177.0, 177.2, 177.4, and 177.6 meters NAVD88, respectively.
| Map (number) | Lake Michigan elevation (meters NAVD88) | Seiche distance (meters) |
|---|---|---|
| 1 | 177.0 | 90 |
| 2 | 177.2 | 210 |
| 3 | 177.4 | 250 |
| 4 | 177.6 | 260 |
Menomonee River
The upstream limit of seiche impacts on the Menomonee River is just downstream of Canal Street. The seiche-impacted distance upstream of the railroad crossing is 1,670, 1,830, 1,870, and 1,940 meters for a 20 centimeter seiche with a lake level of 177.0, 177.2, 177.39, and 177.6 meters NAVD88, respectively.
The relatively gentle slope in this reach means that the seiche affected zone is about 1.5 times longer than the Milwaukee for the same seiche range.
| Map (number) | Lake Michigan elevation (meters NAVD 88) | Seiche distance (meters) |
|---|---|---|
| 5 | 177.0 | 1,670 |
| 6 | 177.2 | 1,830 |
| 7 | 177.39 | 1,870 |
| 8 | 177.6 | 1,940 |
Seiche impacted distances upstream of the railroad bridge as a function of Lake Michigan's elevation.

Kinnickinnic River
The upstream limit of seiche impacts on the Kinnickinnic River is over halfway between I-94 and South 6th Street. The seiche-impacted distance upstream of I-94 is 110, 160, 160, and 280 meters for a 20-centimeter seiche with a lake level of 177.0, 177.2, 177.39, and 177.6 meters NAVD88, respectively.
These distances over the four potential lake levels are similar to those for the Milwaukee River.
| Map (number) | Lake Michigan elevation (meters NAVD88) | Seiche distance (meters) |
|---|---|---|
| 9 | 177.0 | 110 |
| 10 | 177.2 | 160 |
| 11 | 177.39 | 160 |
| 12 | 177.6 | 280 |
Seiche impacted distances upstream of I-94 as a function of Lake Michigan's elevation.

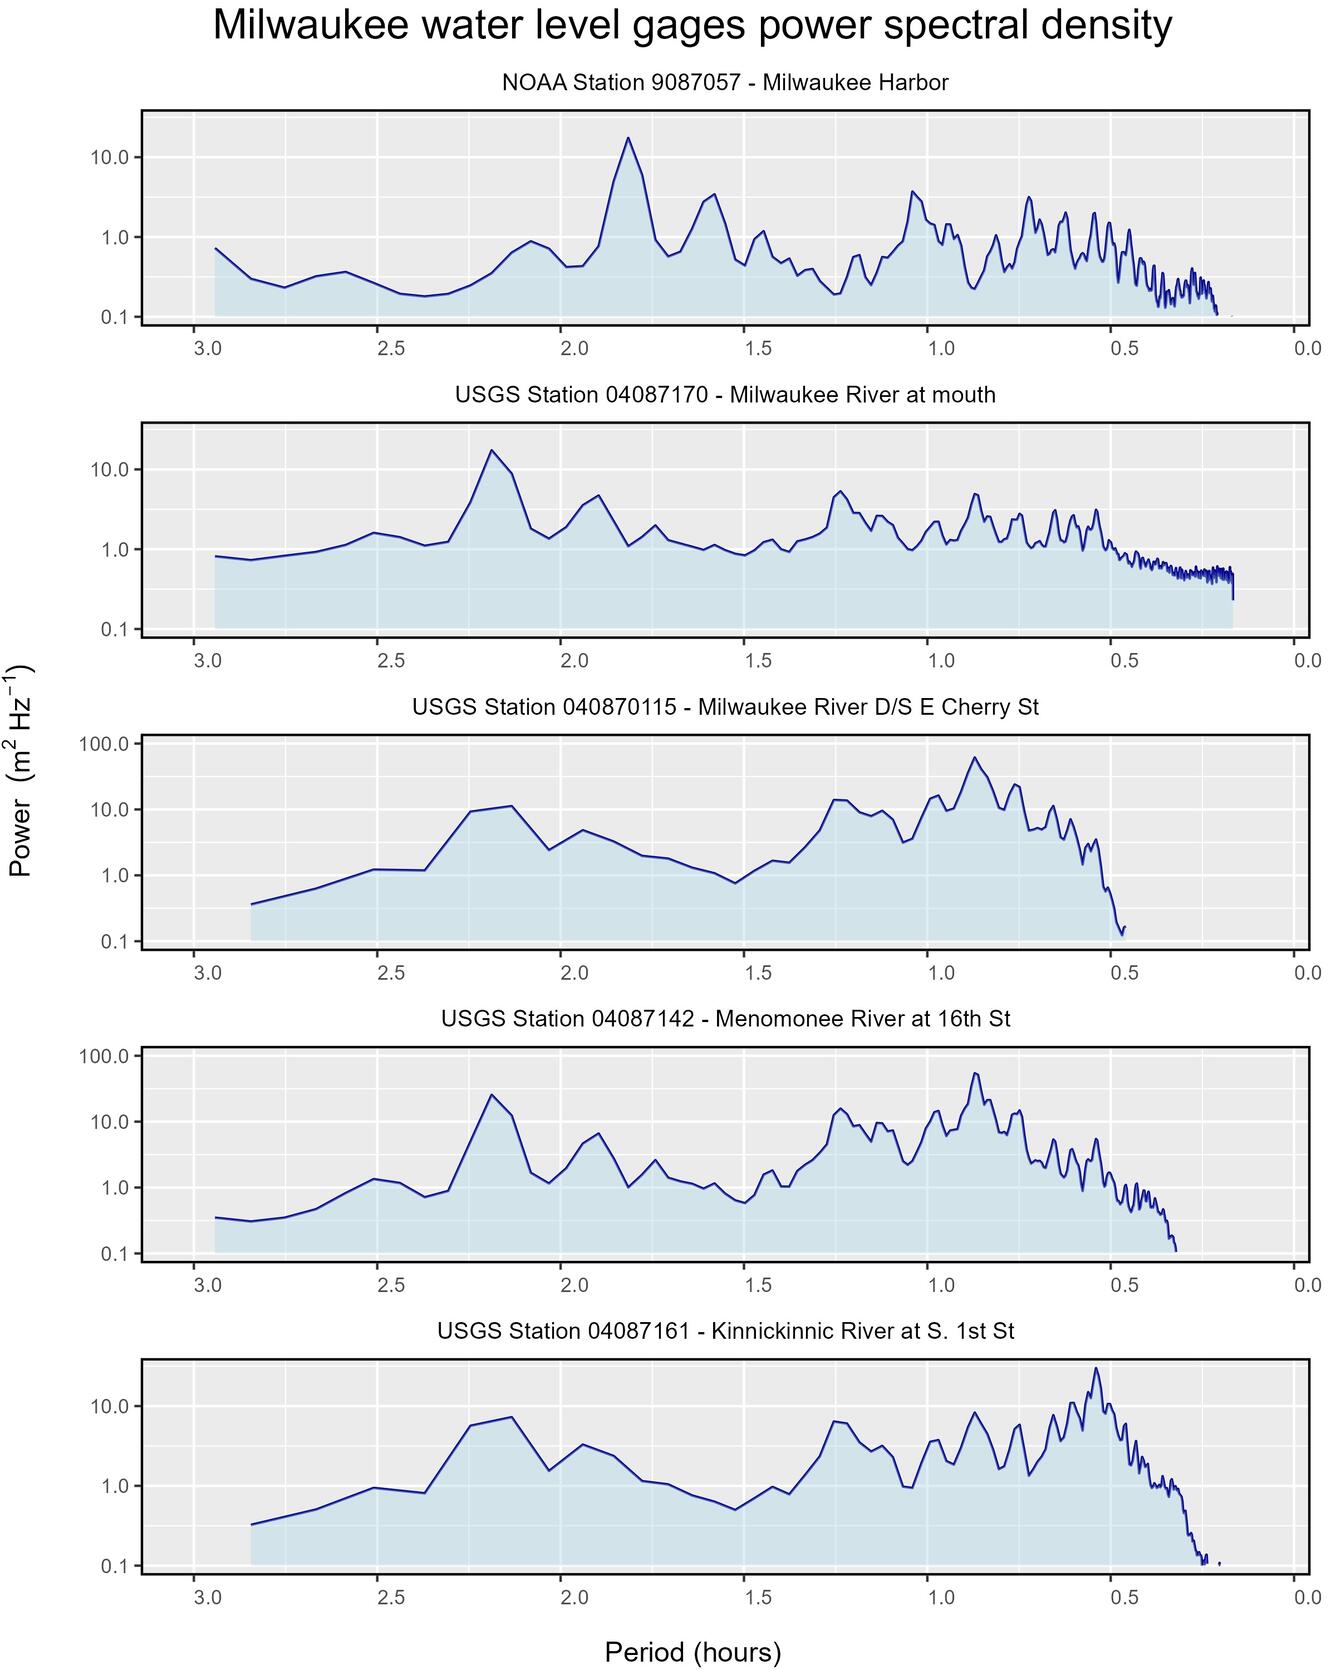
Timing of oscillations
The dominant frequency of water level fluctuations differs between the three tributaries, but in general each tributary experiences oscillations with a period (time between successive wave crests) of 30 minutes to one hour. The figure below displays the power spectral density computed from water level records at the three tributaries, the outer harbor, and the Milwaukee River mouth.
Summary
Water levels in the Milwaukee River Estuary and its tributaries fluctuate multiple times a day from seiche and storm related oscillations originating from Lake Michigan.
The oscillations are observable for about five kilometers upstream in the three tributaries that feed into the estuary – the Milwaukee River, Menomonee River, Kinnickinnic River.
In addition to moving up and down, the water level fluctuations are manifested as flow reversals in the rivers. The upstream extent of the flow reversals depends on overall water levels in Lake Michigan, river flows, and the height or amplitude of the oscillation.
The example animations of notable seiche events in three tributaries in 2019-2020 during high Lake Michigan water levels illustrate the speed and frequency of the seiche oscillations.
The location and timing the oscillations are important to know for protecting, sustaining and restoring aquatic, riparian, and coastal habitats during Lake Michigan cycles of high and low water levels.
Additional Information
Funding provided by the Milwaukee Metropolitan Sewerage District and the USGS Cooperative Matching Fund.
The USGS is participating in numerous ongoing studies of riparian habitat, water quality, and green infrastructure in the Milwaukee area. See related projects and publications linked in the tabs at the top of this page.
How do Lake Michigan water level variations and seiches affect the Milwaukee River estuary, its harbor, and rivers upstream?
Introduction
In Milwaukee, Wisconsin, Lake Michigan water level fluctuations caused by storm surges, wind, and seiches affect the Inner Harbor of the Milwaukee River estuary and cause relatively quick changes in water levels and river currents over just a few hours.
These changes propagate upstream into the three major tributaries that feed into the Inner Harbor and affect fish habitat, water quality, and water temperature. These rivers are:
- Milwaukee River from the north
- Menomonee River from the west
- Kinnickinnic River from the southwest
Two U.S. Geological Survey streamgages are available with water level and velocity data that show these fluctuations.
- USGS streamgage 04087170 Milwaukee River at Mouth at Milwaukee, WI
- USGS streamgage 04087142 Menomonee River at 16th Street at Milwaukee, WI
The water level data from these gages, along with data from now inactive gages on the Kinnickinnic River at South 1 st Street and the Milwaukee River at East Cherry Street, were used to create animations of the spatial footprint of the inundation associated with high frequency water level fluctuations.
To map inundated areas, horizontal surfaces were generated from the water level data and overlain on top of a digital elevation model that included both topographic (above the water) and bathymetric (below the water) elevation data.
The animations include examples of seiche/storm related water-level fluctuations that occurred between 2019 and 2021 when Lake Michigan water levels were at or near record highs.
The distance that the oscillating effects travel upstream in the tributaries depends on the Lake Michigan's water level, tributary discharge, the wind direction, the height of the oscillation, and how steeply the elevation of the riverbed rises proceeding inland and upstream.
Map of two U.S. Geological Survey active streamgages
Explore the areas around the streamgages in the map by using the zoom button in the upper left corner.
Title
Title
Seiches add to the diversity of estuary habitats
A series of habitat maps for the Milwaukee estuary are available from the University of Wisconsin-Milwaukee and show the rich diversity of fish-related habitats associated with a range of vegetation, substrate and forage.
Some species are resident (commonly in the harbor year-round) and others are transient (move into the harbor periodically).
Frequent water level changes are accentuated around the perimeter of the inner harbor, the banks of the tributaries, and the upstream limit of the surge and seiche oscillation.
This helps add to the diversity of habitat types for plant life as well as invertebrates, algae, fish, and wildfowl. Depending on the annual and seasonal changes in lake-wide water levels, different plant species that depend on specific water depth ranges can flourish or fail. Fish occupy the edges for spawning, refuge, and feeding.
The oscillating water levels bring in nutrients and small organisms that fish like to feed on. Water level fluctuations, winds, tributary floods, and water depth add to variability in summer water temperatures.
Water level oscillations and high lake levels meet in the Inner Harbor
Rapid water level changes in the Great Lakes can be caused by several weather events, including strong winds and changes in atmospheric pressure. Seiches are a particular type of rapid water level change where water sloshes back and forth in an enclosed basin, similar to water sloshing in a bathtub.
All of the Great Lakes experience seiches, but their amplitude (height) and periodicity (time between consecutive highs or consecutive lows) varies depending on basin orientation, basin shape, basin bathymetry, and the weather conditions responsible for generating the seiche. Because seiches may continue long after a storm has passed, they can occur unexpectedly and be particularly hazardous.
Rapid water level changes in Lake Michigan are magnified as they pass into the Milwaukee Inner Harbor and instantaneously cause the upriver water levels to change.
On January 11, 2020, a particularly large storm surge of almost three feet (one meter) happened in the Inner Harbor on top of an already high lake level. That surge allowed wind waves to overtop of the sheet piling walls in the connecting channel between the Outer and Inner harbors near Jones Island.
A couple of months later, a large rain event in May 2020 happened during near record lake levels. Water levels are recorded every five minutes at a USGS streamgage at the mouth of the Milwaukee River to monitor these rapid changes.
The National Atmospheric and Oceanic Administration uses the International Great Lakes datum of 1985 (IGLD85) as a base for monitoring water levels on the Great Lakes.
For inland areas, including rivers, the North American Vertical Datum of 1988 (NAVD88) is used. In order to look at how the lake water levels interact with the rivers and the surrounding land, a conversion between IGLD85 and NAVD88 was needed.
The conversion is shown in the table below for Lake Michigan water level statistics, along with the conversion from English feet (ft) to Metric meters (m).
| Lake Michigan | IGLD85 (FT) | NAVD88 (FT) | NAVD88 (M) |
|---|---|---|---|
| Low water datum | 577.5 | 577.65 | 176.07 |
| Ordinary high water mark | 581.5 | 581.65 | 177.29 |
| Long-term average (1918-2023) | 578.87 | 579.02 | 176.49 |
| Record high (June/July 2020) | 582.18 | 582.33 | 177.49 |
| Record low (Jan 2013) | 576.02 | 576.17 | 175.62 |
Over the last 100 years or so, water levels in Lake Michigan have fluctuated by about six feet (two meters). However, record highs and lows happened within the last 15 years, with a monthly record low in January 2013 of 576.02 feet above IGLD 85 (175.62 meters above NAVD 88) and high in June through July of 2020 of 582.18 IGLD 85 (177.49 meters above NAVD 88).
What happens to rapid water level oscillations upstream in the connected rivers?
Water level oscillations extend upstream in rivers differently depending on how quickly the riverbed rises proceeding upstream. The landward margins of the water fluctuations manifest themselves by changing the direction of the river currents.
When the water levels rise the currents reverse and go upstream. When the water levels drop the currents switch and go downstream. At the highest and lowest elevations of the seiche the currents stop altogether for a few seconds before they reverse. The length and location of the river channel affected by these water level oscillations and flow reversals depends on the background lake level in the lake and how steeply the channel bed rises upstream.
Title
Title
Milwaukee River
The upstream limit of seiche impacts on the Milwaukee River is just downstream of the East North Avenue bridge crossing.
The seiche-impacted distance upstream of the old North Avenue Dam / Caesar Park Trail is 90, 210, 250, and 260 meters for a 20-centimeter seiche with a lake level of 177.0, 177.2, 177.4, and 177.6 meters NAVD88, respectively.
| Map (number) | Lake Michigan elevation (meters NAVD88) | Seiche distance (meters) |
|---|---|---|
| 1 | 177.0 | 90 |
| 2 | 177.2 | 210 |
| 3 | 177.4 | 250 |
| 4 | 177.6 | 260 |
Menomonee River
The upstream limit of seiche impacts on the Menomonee River is just downstream of Canal Street. The seiche-impacted distance upstream of the railroad crossing is 1,670, 1,830, 1,870, and 1,940 meters for a 20 centimeter seiche with a lake level of 177.0, 177.2, 177.39, and 177.6 meters NAVD88, respectively.
The relatively gentle slope in this reach means that the seiche affected zone is about 1.5 times longer than the Milwaukee for the same seiche range.
| Map (number) | Lake Michigan elevation (meters NAVD 88) | Seiche distance (meters) |
|---|---|---|
| 5 | 177.0 | 1,670 |
| 6 | 177.2 | 1,830 |
| 7 | 177.39 | 1,870 |
| 8 | 177.6 | 1,940 |
Seiche impacted distances upstream of the railroad bridge as a function of Lake Michigan's elevation.
Kinnickinnic River
The upstream limit of seiche impacts on the Kinnickinnic River is over halfway between I-94 and South 6th Street. The seiche-impacted distance upstream of I-94 is 110, 160, 160, and 280 meters for a 20-centimeter seiche with a lake level of 177.0, 177.2, 177.39, and 177.6 meters NAVD88, respectively.
These distances over the four potential lake levels are similar to those for the Milwaukee River.
| Map (number) | Lake Michigan elevation (meters NAVD88) | Seiche distance (meters) |
|---|---|---|
| 9 | 177.0 | 110 |
| 10 | 177.2 | 160 |
| 11 | 177.39 | 160 |
| 12 | 177.6 | 280 |
Seiche impacted distances upstream of I-94 as a function of Lake Michigan's elevation.
Timing of oscillations
The dominant frequency of water level fluctuations differs between the three tributaries, but in general each tributary experiences oscillations with a period (time between successive wave crests) of 30 minutes to one hour. The figure below displays the power spectral density computed from water level records at the three tributaries, the outer harbor, and the Milwaukee River mouth.
Summary
Water levels in the Milwaukee River Estuary and its tributaries fluctuate multiple times a day from seiche and storm related oscillations originating from Lake Michigan.
The oscillations are observable for about five kilometers upstream in the three tributaries that feed into the estuary – the Milwaukee River, Menomonee River, Kinnickinnic River.
In addition to moving up and down, the water level fluctuations are manifested as flow reversals in the rivers. The upstream extent of the flow reversals depends on overall water levels in Lake Michigan, river flows, and the height or amplitude of the oscillation.
The example animations of notable seiche events in three tributaries in 2019-2020 during high Lake Michigan water levels illustrate the speed and frequency of the seiche oscillations.
The location and timing the oscillations are important to know for protecting, sustaining and restoring aquatic, riparian, and coastal habitats during Lake Michigan cycles of high and low water levels.
Additional Information
Funding provided by the Milwaukee Metropolitan Sewerage District and the USGS Cooperative Matching Fund.
The USGS is participating in numerous ongoing studies of riparian habitat, water quality, and green infrastructure in the Milwaukee area. See related projects and publications linked in the tabs at the top of this page.