
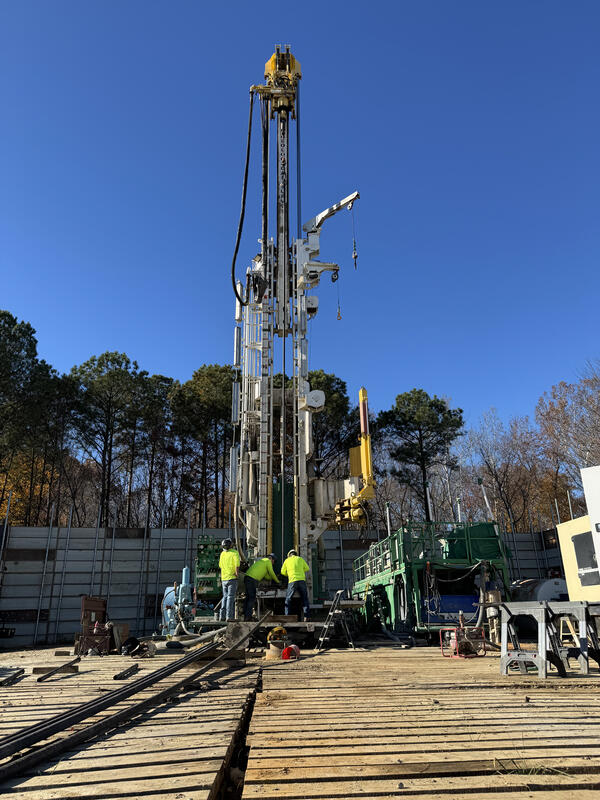
Drillers from the USGS Research Drilling Program using a drill rig to install a 42 foot length of schedule 80 extensometer pipe at the James River extensometer site.
Multimedia
Our multimedia gallery presents a collection of images, videos, posters, and audio associated with our projects. All items in this gallery are considered public domain unless otherwise noted.
Images
James River Extensometer Installation
Drillers from the USGS Research Drilling Program using a drill rig to install a 42 foot length of schedule 80 extensometer pipe at the James River extensometer site.
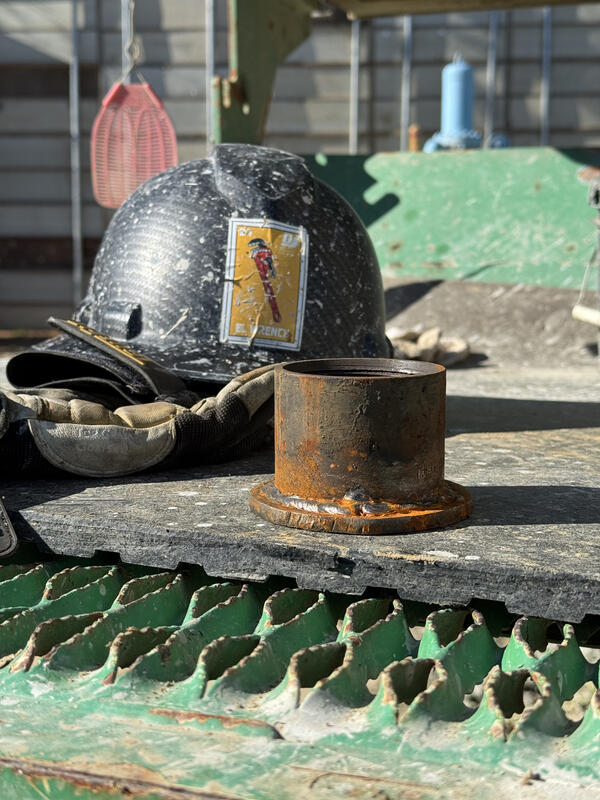
Extensometer Foot
The foot of the James River Extensometer shortly before installation, with a nearby hardhat for scale. The extensometer foot is installed at the very base of the extensometer hole, at a depth of 1280 feet in the case of the James River Extensometer. All 1280 feet of extensometer pipe gently rests on the extensometer foot.
The foot of the James River Extensometer shortly before installation, with a nearby hardhat for scale. The extensometer foot is installed at the very base of the extensometer hole, at a depth of 1280 feet in the case of the James River Extensometer. All 1280 feet of extensometer pipe gently rests on the extensometer foot.
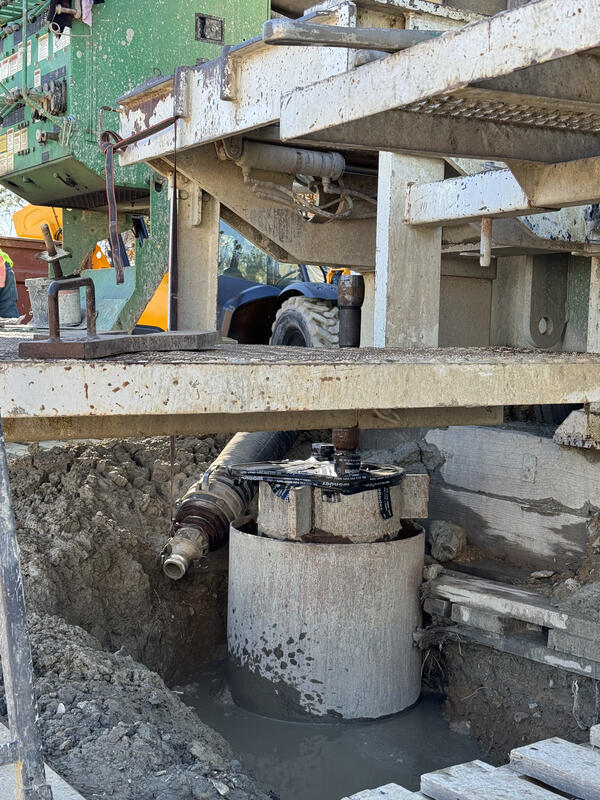
James River Deep Extensometer After Completion of Drilling
James River Deep Extensometer After Completion of DrillingThe completed Jame River extensometer borehole. The nested 24-inch diameter conductor casing, 16-inch diameter surface casing, 7-inch diameter steel casing, and the 2-inch diameter extensometer rod are all visible protruding upwards from the ground.
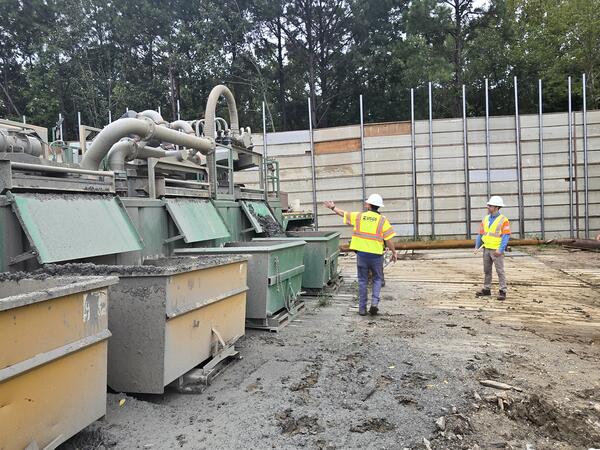
Tour of the James River Extensometer drill site
Greg Connock, a USGS geologist, leads a tour of the James River Extensometer drill site. He indicates where drilled sediments are deposited out of the shaker.
Greg Connock, a USGS geologist, leads a tour of the James River Extensometer drill site. He indicates where drilled sediments are deposited out of the shaker.
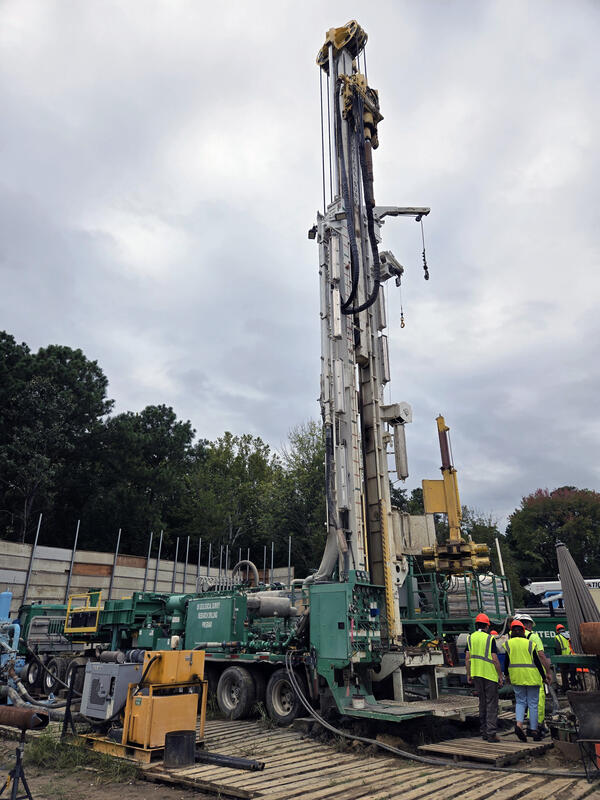
Drilling the James River Extensometer
A USGS Research Drilling Program rig at the site of the James River Extensometer.
A USGS Research Drilling Program rig at the site of the James River Extensometer.
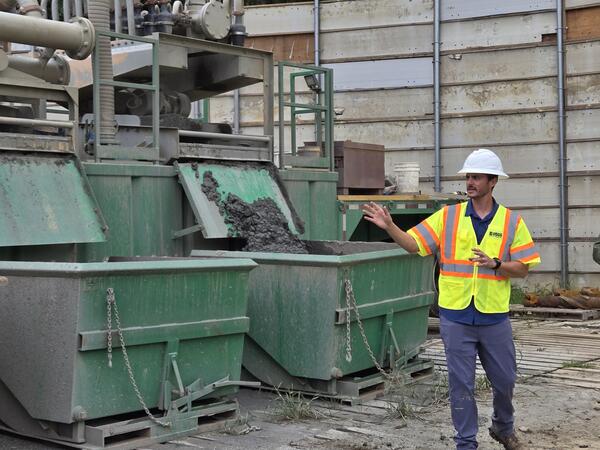
Geologist Greg Connock giving a tour of a USGS drill rig
Geologist Greg Connock giving a tour of a USGS drill rigUSGS Geologist Greg Connock gives a tour of a drill rig at the James River Extensometer drill site during a community outreach event.
Geologist Greg Connock giving a tour of a USGS drill rig
Geologist Greg Connock giving a tour of a USGS drill rigUSGS Geologist Greg Connock gives a tour of a drill rig at the James River Extensometer drill site during a community outreach event.
Videos

Fairfax County Lake Accotink Sedimentation Study
The USGS is monitoring Lake Accotink, Accotink Creek, and Long Branch to better understand sediment flow into and out of the lake.
The USGS is monitoring Lake Accotink, Accotink Creek, and Long Branch to better understand sediment flow into and out of the lake.

Everglades Restoration Goals
This video covers the history of the South Florida ecosystem, from the early drainage projects in the 1880s up through current restoration projects designed to reverse the major unintended impacts to this unique ecosystem. All major restoration projects and proposed future projects are covered.
This video covers the history of the South Florida ecosystem, from the early drainage projects in the 1880s up through current restoration projects designed to reverse the major unintended impacts to this unique ecosystem. All major restoration projects and proposed future projects are covered.
")
Chesapeake Bay Status and Trends (AD)
The Chesapeake Bay is one of the Nation's largest ecosystem restoration efforts, so monitoring to assess changes in condition is crucial. The USGS is monitoring the status and trends of key indicators for the health of streams and rivers in the Chesapeake Bay watershed.
The Chesapeake Bay is one of the Nation's largest ecosystem restoration efforts, so monitoring to assess changes in condition is crucial. The USGS is monitoring the status and trends of key indicators for the health of streams and rivers in the Chesapeake Bay watershed.
Chesapeake Bay Status and Trends
The Chesapeake Bay is one of the Nation's largest ecosystem restoration efforts, so monitoring to assess changes in condition is crucial. The USGS is monitoring the status and trends of key indicators for the health of streams and rivers in the Chesapeake Bay watershed.
The Chesapeake Bay is one of the Nation's largest ecosystem restoration efforts, so monitoring to assess changes in condition is crucial. The USGS is monitoring the status and trends of key indicators for the health of streams and rivers in the Chesapeake Bay watershed.

USGS Extensometer Drilling in Virginia
Along the Atlantic Coast, a 2000+ ft deep hole has been drilled by the USGS to assess the issues of groundwater pumping, relative sea-level rise, and land subsidence. This video shows the drilling of the first extensometer to measure land subsidence in the North Atlantic Coastal Plain in 30+ years.
Along the Atlantic Coast, a 2000+ ft deep hole has been drilled by the USGS to assess the issues of groundwater pumping, relative sea-level rise, and land subsidence. This video shows the drilling of the first extensometer to measure land subsidence in the North Atlantic Coastal Plain in 30+ years.
Webcams
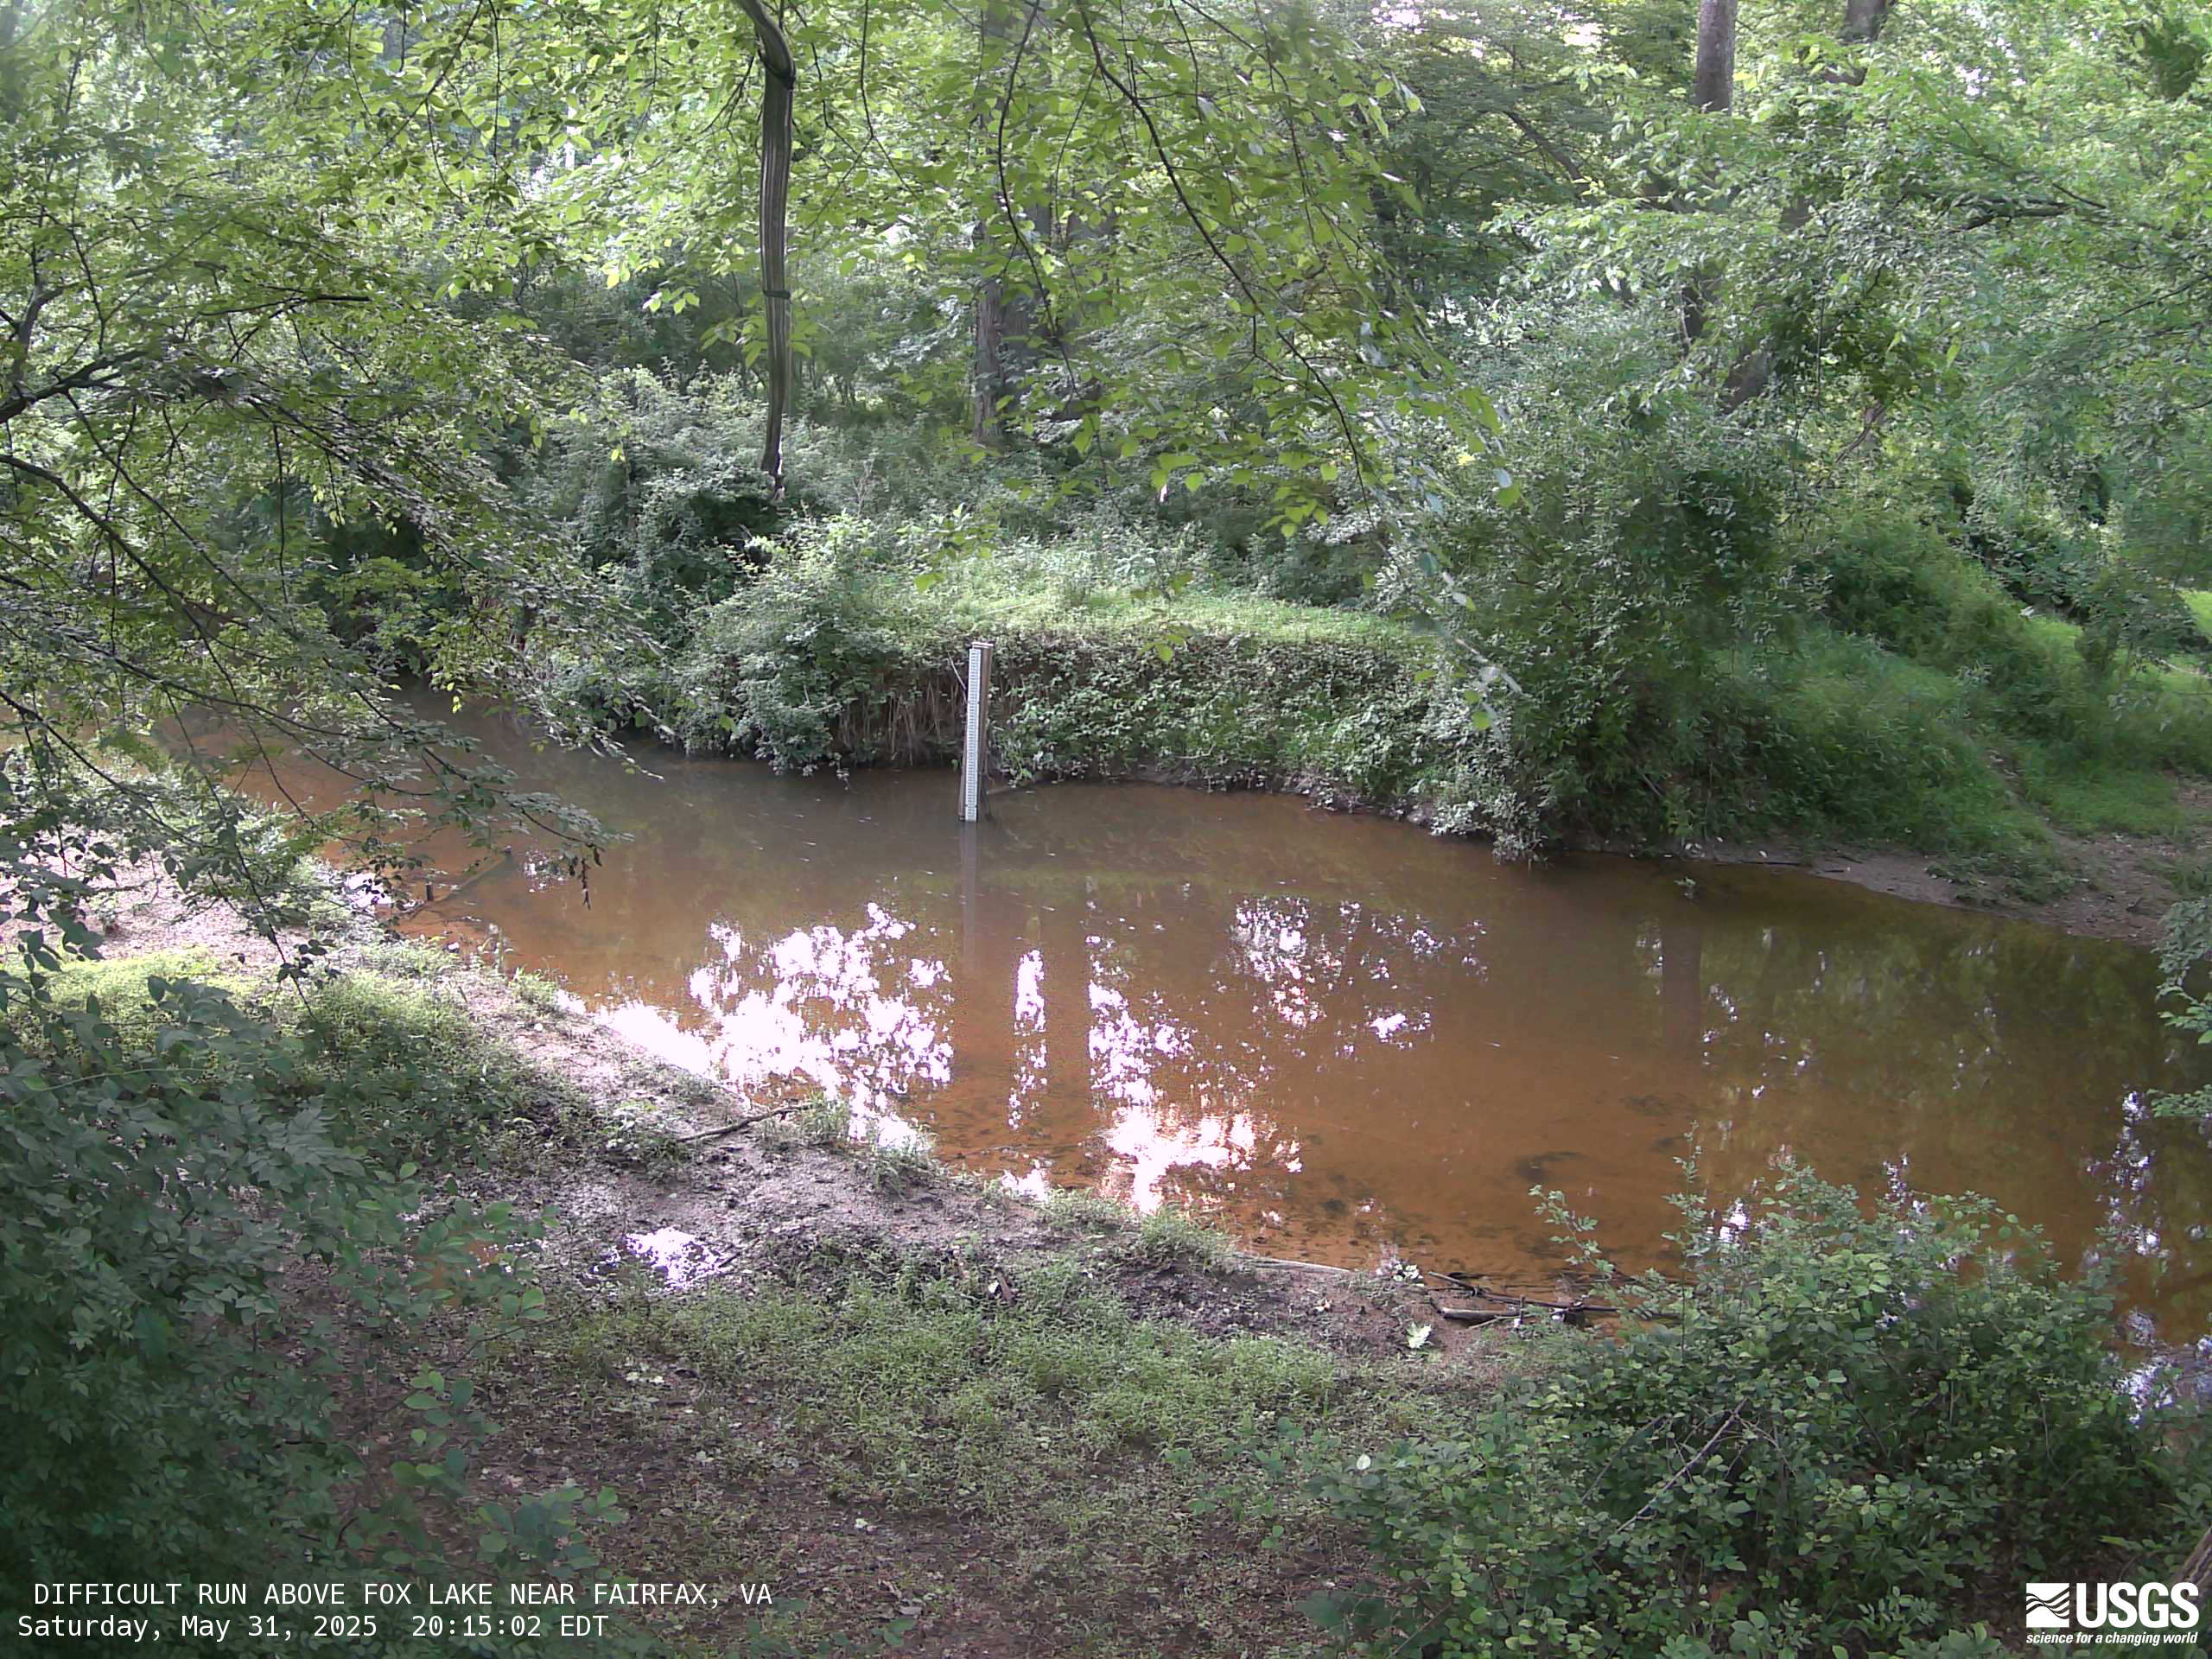
Difficult Run Above Fox Lake Near Fairfax, Virginia
Difficult Run Above Fox Lake Near Fairfax, VirginiaMost recent imagery of the Difficult Run stream in Fairfax VA. Visit the webcam site for previous images, timelapse video, and measured parameters.
This webcam is a part of the Fairfax County Water Resources Monitoring Network.

Flatlick Branch Above Frog Branch at Chantilly, Virginia
Flatlick Branch Above Frog Branch at Chantilly, VirginiaMost recent imagery of the Flatlick Branch stream in Fairfax VA. Visit the webcam site for previous images, timelapse video, and measured parameters.
Flatlick Branch Above Frog Branch at Chantilly, Virginia
Flatlick Branch Above Frog Branch at Chantilly, VirginiaMost recent imagery of the Flatlick Branch stream in Fairfax VA. Visit the webcam site for previous images, timelapse video, and measured parameters.
Dead Run at Whann Avenue Near Mclean, Virginia
Most recent imagery of the Dead Run stream in Fairfax VA. Visit the webcam site for previous images, timelapse video, and measured parameters.
This webcam is a part of the Fairfax County Water Resources Monitoring Network.
Most recent imagery of the Dead Run stream in Fairfax VA. Visit the webcam site for previous images, timelapse video, and measured parameters.
This webcam is a part of the Fairfax County Water Resources Monitoring Network.

South Fork Little Difficult Run Above Mouth Near Vienna
South Fork Little Difficult Run Above Mouth Near ViennaMost recent imagery of the South Fork of Little Difficult Run stream in Fairfax VA. Visit the webcam site for previous images, timelapse video, and measured parameters.
South Fork Little Difficult Run Above Mouth Near Vienna
South Fork Little Difficult Run Above Mouth Near ViennaMost recent imagery of the South Fork of Little Difficult Run stream in Fairfax VA. Visit the webcam site for previous images, timelapse video, and measured parameters.

Conveyance Chain at Ramsgate Lane, Hampton Roads
Most recent imagery from USGS site 0204309906, the conveyance chain at Ramsgate Lane in Hampton Roads, Virginia. Visit the webcam site for previous images, timelapse video, and measured parameters.
Most recent imagery from USGS site 0204309906, the conveyance chain at Ramsgate Lane in Hampton Roads, Virginia. Visit the webcam site for previous images, timelapse video, and measured parameters.

Long Branch at Olley Lane
Most recent imagery of the Long Branch stream in Fairfax VA. Visit the webcam site for previous images, timelapse video, and measured parameters.
This webcam is a part of the Fairfax County Water Resources Monitoring Network.
Most recent imagery of the Long Branch stream in Fairfax VA. Visit the webcam site for previous images, timelapse video, and measured parameters.
This webcam is a part of the Fairfax County Water Resources Monitoring Network.