
Greater Sage-Grouse Population Monitoring Framework: Trends Analysis Information Sheet
Land and wildlife managers require accurate estimates of sensitive species’ trends to help guide conservation decisions that maintain biodiversity and promote healthy ecosystems. Accurately assessing greater sage-grouse (Centrocercus urophasianus; sage-grouse) population trends can be difficult because of (1) missing lek counts or incomplete repeat counts, (2) variation in counts from observer error, (3) mismatches among administrative and biological/population boundaries (the former may fail to capture drivers of regional and population-level performance), and (4) natural variations in sage-grouse population size stemming from cyclical patterns. The purpose of this analysis was to estimate trends of sage-grouse populations across their range in the United States in a manner that addressed each of these obstacles.
Accounting for Imperfect Lek Counts
A substantial challenge facing trend estimation for sage-grouse populations is the incomplete time series of count data associated with many leks. Previous studies have dealt with this by excluding populations with irregular data. However, a shortcoming of this approach is that inferences can be restricted in both time and space. Therefore, we implemented a modeling approach that enabled information to be shared across aggregations of spatially structured leks. The observation component of that model was designed to address imperfect detection, which is well documented in sage-grouse populations.
Assessing Trends at Relevant Spatial Scales
This modeling approach included three spatial scales that are biologically relevant to sage-grouse: (1) the lek scale, which is the smallest scale at which managers monitor sage-grouse populations, (2) the Neighborhood Cluster scale, which captures movement among leks and represents trends that may be driven by local conditions (Figure 1b), and (3) the Climate Cluster scale, which captures trends that are driven by broad-scale climatic conditions (Figure 1a). Estimates of population change at lek and Neighborhood Cluster scales were made available during years of missing data by sampling from probability distributions that were based on (1) hierarchically nested spatial relationships and (2) within-population variability in rate of change parameters estimated from the available data.


Assessing Trends at Relevant Temporal Scales
Inter-annual variation in abundance is common among sage-grouse populations and stems from cyclic climatic conditions that have been linked to availability of resources. This relationship results in a pattern of relatively short increases and decreases in population size that operate irrespective of long-term trend (Figure 2a). Calculating trends from short-term gains and losses can lead to erroneous conclusions about population performance. Recent studies have demonstrated that sage-grouse oscillations occur on average at 6–12-year intervals. As such, studies of sage-grouse population trends should use datasets spanning multiple decades and include start and stop years that represent one or more complete oscillations. Therefore, we restricted inferences to complete oscillations and examined population trends across multiple time periods (Figure 2b), each containing a different number of complete oscillations over the past 6 decades (1960–2024). We used population abundance nadirs (low points) rather than apexes (high points), to define start-stop temporal scales of inference. Variability was lower among nadirs than among apexes, yielding more consistent estimates of population trends, and was considered more relevant for managers because populations are at greater risk of extirpation when abundance is low.
Results and Implications
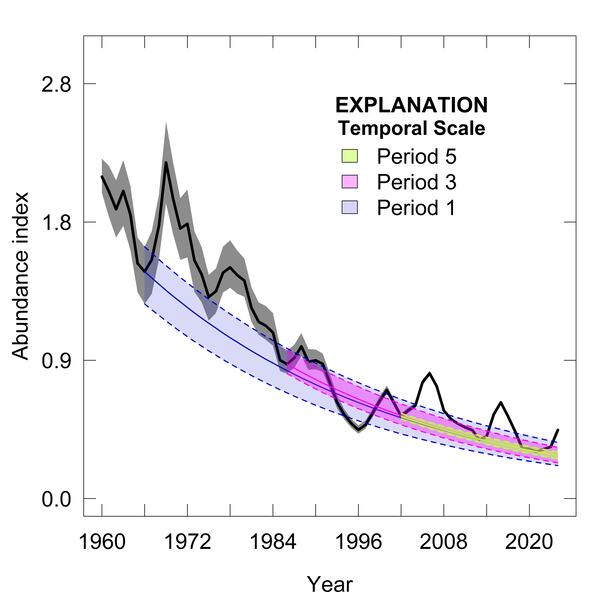
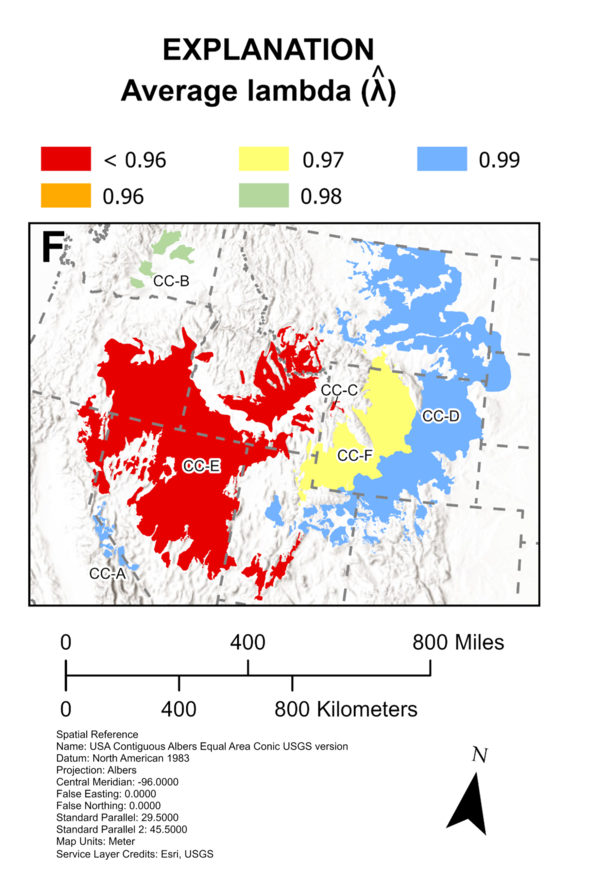
There was an average 2.9% annual decline in sage-grouse abundance across the range (Figure 3). We found a 78.8% decrease in abundance during Period 1 (55 years; 1966–2021) and a 41.2% decline during Period 5 (19 years; 2002–2021). There was variation in trends by climate cluster (Figure 4). The Bi-State Climate Cluster1 (CC-A) had the lowest rate of decline during Period 1 (1.3%), while the Jackson Hole, Wyoming Climate Cluster (CC-C) had the greatest decline (5.9%).
As an extension of our analysis, we projected abundance into the future for each lek and Neighborhood Cluster using three temporal scales that reflected two, four, and six oscillations in the future. We then calculated the proportion of the abundance distribution that was less than two male sage-grouse (minimum number to represent a lek) for the last prediction year of each temporal scale. Although this value is not true extirpation (zero or one bird), we refer to it as extirpation to align with state definitions of lek inactivity. Thus, this proportion of the distribution represented the probability of extirpation for each lek and Neighborhood Cluster at the nadir, across approximately two, four, and six oscillations in the future. Extirpation of leks within a Neighborhood Cluster was thought to reflect a loss of the metapopulation due to reduced demographic rates.
This framework allows managers to assess and compare trends across different time periods and spatial extents. Because of the use of nadir-to-nadir (trough-to-trough) comparisons, managers can accurately compare trends over short time periods with those over long time periods to determine whether populations are declining due to chronic stressors or recent disturbance. Additionally, comparing trends across spatial scales can highlight potential causes of sage-grouse declines and inform management actions. Trends at the Climate Cluster scale can be used to assess regional performance of sage-grouse populations and point to declines driven by climatic factors. Trends within neighborhood clusters can reveal information regarding local disturbances that may be mitigated through management actions. The extirpation probabilities from the analysis can help managers prioritize declining populations by identifying areas at risk of loss.
Co-production
We continue working with all collaborators to improve sage-grouse management tools. Each year, an updated version of a range-wide standardized lek count database is developed to include new counts and historical corrections (e.g., transfer of paper records to digital files) with improvements to data quality using rigorous quality control (quality assurance) methods. These data are incorporated into the hierarchical population modeling framework to produce results for use in annual decision making. Because sage-grouse populations oscillate at 6–12-year intervals, population trends may change more slowly depending on the timing of the interval.
Data restrictions
State wildlife agencies collect and manage lek databases. Because sage-grouse are a species of conservation concern and sensitive to activities during breeding, these data are available only after acquiring formal data-sharing agreements with individual states.
Funders
U.S. Geological Survey (Ecosystems Mission Area, Land Management Research Program and Species Management Research Program, Wyoming Landscape Conservation Initiative) and U.S. Bureau of Land Management.
Partners
State Wildlife Agencies (California Department of Fish and Wildlife; Colorado Parks and Wildlife; Idaho Department of Fish and Game; Montana Fish, Wildlife & Parks; Nevada Department of Wildlife; North Dakota Game and Fish Department; Oregon Department of Fish and Wildlife; South Dakota Department of Game, Fish and Parks; Utah Division of Wildlife Resources; Wyoming Game and Fish Department; Washington Department of Fish and Wildlife), Colorado State University, BLM, US Fish and Wildlife Service, US Forest Service, researchers who provided field data to evaluate results.

Data Harmonization for Greater Sage-Grouse Populations

Greater Sage-Grouse Population Monitoring Framework

Estimating trends for greater sage-grouse populations within highly stochastic environments

Hierarchical Units of Greater Sage-Grouse Populations Informing Wildlife Management
Land and wildlife managers require accurate estimates of sensitive species’ trends to help guide conservation decisions that maintain biodiversity and promote healthy ecosystems. Accurately assessing greater sage-grouse (Centrocercus urophasianus; sage-grouse) population trends can be difficult because of (1) missing lek counts or incomplete repeat counts, (2) variation in counts from observer error, (3) mismatches among administrative and biological/population boundaries (the former may fail to capture drivers of regional and population-level performance), and (4) natural variations in sage-grouse population size stemming from cyclical patterns. The purpose of this analysis was to estimate trends of sage-grouse populations across their range in the United States in a manner that addressed each of these obstacles.
Accounting for Imperfect Lek Counts
A substantial challenge facing trend estimation for sage-grouse populations is the incomplete time series of count data associated with many leks. Previous studies have dealt with this by excluding populations with irregular data. However, a shortcoming of this approach is that inferences can be restricted in both time and space. Therefore, we implemented a modeling approach that enabled information to be shared across aggregations of spatially structured leks. The observation component of that model was designed to address imperfect detection, which is well documented in sage-grouse populations.
Assessing Trends at Relevant Spatial Scales
This modeling approach included three spatial scales that are biologically relevant to sage-grouse: (1) the lek scale, which is the smallest scale at which managers monitor sage-grouse populations, (2) the Neighborhood Cluster scale, which captures movement among leks and represents trends that may be driven by local conditions (Figure 1b), and (3) the Climate Cluster scale, which captures trends that are driven by broad-scale climatic conditions (Figure 1a). Estimates of population change at lek and Neighborhood Cluster scales were made available during years of missing data by sampling from probability distributions that were based on (1) hierarchically nested spatial relationships and (2) within-population variability in rate of change parameters estimated from the available data.
Assessing Trends at Relevant Temporal Scales
Inter-annual variation in abundance is common among sage-grouse populations and stems from cyclic climatic conditions that have been linked to availability of resources. This relationship results in a pattern of relatively short increases and decreases in population size that operate irrespective of long-term trend (Figure 2a). Calculating trends from short-term gains and losses can lead to erroneous conclusions about population performance. Recent studies have demonstrated that sage-grouse oscillations occur on average at 6–12-year intervals. As such, studies of sage-grouse population trends should use datasets spanning multiple decades and include start and stop years that represent one or more complete oscillations. Therefore, we restricted inferences to complete oscillations and examined population trends across multiple time periods (Figure 2b), each containing a different number of complete oscillations over the past 6 decades (1960–2024). We used population abundance nadirs (low points) rather than apexes (high points), to define start-stop temporal scales of inference. Variability was lower among nadirs than among apexes, yielding more consistent estimates of population trends, and was considered more relevant for managers because populations are at greater risk of extirpation when abundance is low.
Results and Implications
There was an average 2.9% annual decline in sage-grouse abundance across the range (Figure 3). We found a 78.8% decrease in abundance during Period 1 (55 years; 1966–2021) and a 41.2% decline during Period 5 (19 years; 2002–2021). There was variation in trends by climate cluster (Figure 4). The Bi-State Climate Cluster1 (CC-A) had the lowest rate of decline during Period 1 (1.3%), while the Jackson Hole, Wyoming Climate Cluster (CC-C) had the greatest decline (5.9%).
As an extension of our analysis, we projected abundance into the future for each lek and Neighborhood Cluster using three temporal scales that reflected two, four, and six oscillations in the future. We then calculated the proportion of the abundance distribution that was less than two male sage-grouse (minimum number to represent a lek) for the last prediction year of each temporal scale. Although this value is not true extirpation (zero or one bird), we refer to it as extirpation to align with state definitions of lek inactivity. Thus, this proportion of the distribution represented the probability of extirpation for each lek and Neighborhood Cluster at the nadir, across approximately two, four, and six oscillations in the future. Extirpation of leks within a Neighborhood Cluster was thought to reflect a loss of the metapopulation due to reduced demographic rates.
This framework allows managers to assess and compare trends across different time periods and spatial extents. Because of the use of nadir-to-nadir (trough-to-trough) comparisons, managers can accurately compare trends over short time periods with those over long time periods to determine whether populations are declining due to chronic stressors or recent disturbance. Additionally, comparing trends across spatial scales can highlight potential causes of sage-grouse declines and inform management actions. Trends at the Climate Cluster scale can be used to assess regional performance of sage-grouse populations and point to declines driven by climatic factors. Trends within neighborhood clusters can reveal information regarding local disturbances that may be mitigated through management actions. The extirpation probabilities from the analysis can help managers prioritize declining populations by identifying areas at risk of loss.
Co-production
We continue working with all collaborators to improve sage-grouse management tools. Each year, an updated version of a range-wide standardized lek count database is developed to include new counts and historical corrections (e.g., transfer of paper records to digital files) with improvements to data quality using rigorous quality control (quality assurance) methods. These data are incorporated into the hierarchical population modeling framework to produce results for use in annual decision making. Because sage-grouse populations oscillate at 6–12-year intervals, population trends may change more slowly depending on the timing of the interval.
Data restrictions
State wildlife agencies collect and manage lek databases. Because sage-grouse are a species of conservation concern and sensitive to activities during breeding, these data are available only after acquiring formal data-sharing agreements with individual states.
Funders
U.S. Geological Survey (Ecosystems Mission Area, Land Management Research Program and Species Management Research Program, Wyoming Landscape Conservation Initiative) and U.S. Bureau of Land Management.
Partners
State Wildlife Agencies (California Department of Fish and Wildlife; Colorado Parks and Wildlife; Idaho Department of Fish and Game; Montana Fish, Wildlife & Parks; Nevada Department of Wildlife; North Dakota Game and Fish Department; Oregon Department of Fish and Wildlife; South Dakota Department of Game, Fish and Parks; Utah Division of Wildlife Resources; Wyoming Game and Fish Department; Washington Department of Fish and Wildlife), Colorado State University, BLM, US Fish and Wildlife Service, US Forest Service, researchers who provided field data to evaluate results.
Data Harmonization for Greater Sage-Grouse Populations
Greater Sage-Grouse Population Monitoring Framework
Estimating trends for greater sage-grouse populations within highly stochastic environments