
Greater Sage-Grouse Population Monitoring Framework
Greater sage-grouse (Centrocercus urophasianus) are at the center of state and national land use policies largely because of their unique life-history traits and their role as an ecological indicator for the health of sagebrush ecosystems. Multiple science centers with the U.S. Geological Survey (USGS) in conjunction with Colorado State University (CSU) have developed the Greater Sage-Grouse Population Monitoring Framework to support decision-making processes by U.S. Department of the Interior (Bureau of Land Management, U.S. Fish and Wildlife Service) and U.S. Department of Agriculture (U.S. Forest Service and Natural Resources Conservation Service) resource agencies for managing sage-grouse populations and the sagebrush ecosystems that they depend upon for survival and reproduction.

Framework Components
Read an overview of the framework and its components on this page, or explore individual components through the links below.
Background
Greater sage-grouse are a sagebrush-obligate bird that currently occupy most sagebrush ecosystems across 11 states in the U.S. and 2 Canadian Provinces in western North America. At the turn of the twenty-first century, sage-grouse occupied roughly half of their former historical range, and over the past three to five decades, they have demonstrated apparent population declines in many parts of their current range.
Sage-grouse are considered an indicator of the integrity of sagebrush ecosystems, as well as an umbrella species for the protection of other sagebrush species given their near-complete dependence on sagebrush ecosystems throughout their life. In 2015, the U.S. Fish and Wildlife Service determined greater sage-grouse were not warranted for listing under the Endangered Species Act. However, it was noted that maintaining sage-grouse populations at non-threatened levels and improving sage-grouse habitats and population health required greater integration of adaptive management into land-use planning. To meet this need, they suggested several different methods for sage-grouse population monitoring as current approaches made it difficult to manage and monitor sage-grouse across time and administrative boundaries. The Greater Sage-grouse Monitoring Framework and the SagePop application were designed to address these issues, providing a standardized and accurate way to track sage-grouse populations across the entire sagebrush biome and over time periods going back more than 40 years.
Research Objective
The purpose of the Greater Sage-Grouse Population Monitoring Framework is to allow managers to identify changing sage-grouse population trends and assess the influence of landscape characteristics on those trends across multiple spatial and temporal scales. The framework serves a dual purpose:
- allow sage-grouse population trends to be readily and accurately calculated at multiple spatial scales to meet best available science needs for state and federal resource agencies, and
- provide the basis for signaling the need for management actions by federal or state agencies to stabilize declining populations at different spatial scales.
The framework was developed in close collaboration with Western state wildlife agencies and multiple federal agency partners and is designed to provide annually updated results for timely management decisions and policy. It is comprised of five components, each with their own research objective and science deliverable.
1. Lek Database
Western state wildlife agencies identified the need for a single comprehensive database of lek count data and locations. The first component of the framework developed automated, repeatable methods for integrating lek-count data into a unified database. The software developed for this component enables the easy addition of new data to the database, thereby building the historical record of lek data and supporting timely analysis with the most up-to-date inputs.
More information on this data harmonization project.
2. Spatial Clusters

While understanding population trends within geographical units such as states or management districts is necessary for practitioners, populations may respond to environmental factors that do not align with these boundaries, as wildlife regularly move across jurisdictional boundaries. This component of the framework assessed and identified thirteen biologically relevant, hierarchically nested units of analysis that capture the drivers of population changes at different spatial scales (Figure 1). The framework analyzes population trends within three spatial scales: the climate cluster (regional - largest cluster scale), the neighborhood cluster (population - third smallest cluster scale), and the individual lek (local). The climate and neighborhood cluster scales are two of the 13 original products.
More information on the development of the clusters.
3. Greater Sage-grouse Trends
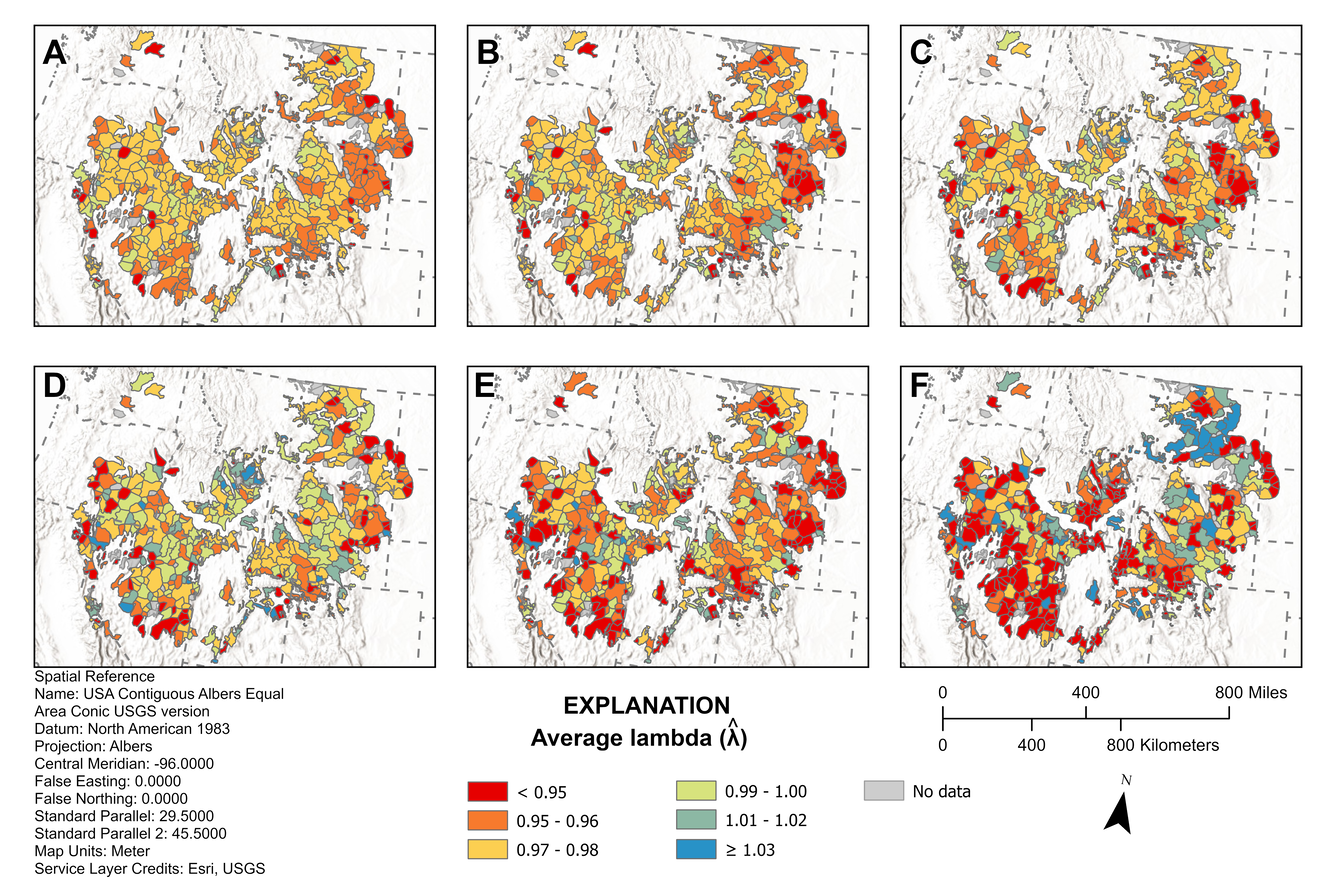
Sage-grouse populations naturally vary both within years and across approximately 9-year oscillations. This can complicate the estimation of sage-grouse trends over time. The framework used state-of-the-art models to identify six different low points in range-wide sage-grouse abundance from 1953 – 2024. Comparing population abundance across low points provides a more accurate estimate of trends over time.
More information on sage-grouse trends.
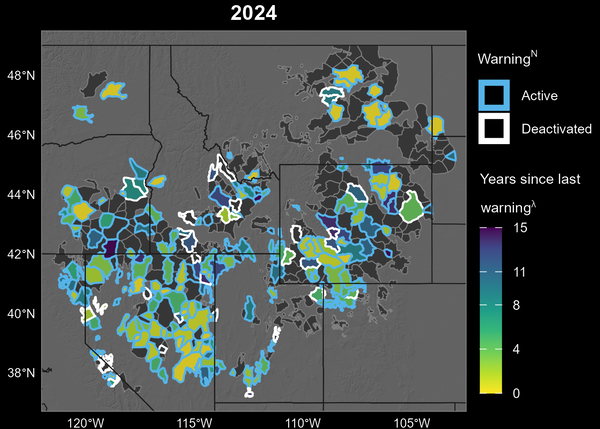
4. Targeted Annual Warning System (TAWS)
Understanding when and where populations are declining, and whether declines are attributable to factors that can be managed (for example, disturbances such as wildfire), can help managers develop effective management strategies. The targeted annual warning system (TAWS) identifies when a population or lek is declining at a rate that differs from the larger regional trend. This “signal” allows managers to distinguish regional declines driven by uncontrollable factors (for example, environmental conditions) from local declines attributable to disturbances that may be mitigated by management intervention.
The TAWS assigns a different severity (that is, a watch or warning) depending on the rate and duration of the decline. Watches may indicate the need for intensive monitoring, whereas warnings may signal the need for management interventions to stabilize populations. In addition, the TAWS informs managers when a population has signaled previously, informed by past patterns from lek count data, modeled across scales. This historical look at population signals promotes adaptive management by identifying persistent effects on population declines and by allowing managers to assess the outcomes of management actions.
More information about the Targeted Annual Warning System.
5. Web Tool
The framework is operationalized through a web-based decision-support tool called SagePop that allows partners to securely access trends and TAWS results for their area and period of interest. The application distills the results into relevant outputs such as maps, figures, and tables that can be directly incorporated into management plans. The framework's design promotes “living” products that are updated annually and loaded into the SagePop tool to facilitate timely management interventions and adaptive management.
More information on the SagePop web tool.
Co-production
We continue working with all collaborators to improve science, that is the foundation of these products and tools, which can help to inform sage-grouse management. Each year, we develop an updated version of a range-wide standardized lek count database to include new counts and historical corrections, and to improve data quality through rigorous quality-control and assurance methods. During this process, software is updated, peer-reviewed, and released to the public. The trends and TAWS models are then run annually with the most recent lek data provided by state partners. The results are released in a data series report and are then integrated back into the SagePop Tool for use by federal and state agency partners. We continue to inform partners of model updates and improvements and to facilitate the incorporation of new features and outputs into the application.
Data Restrictions
State wildlife agencies collect and manage lek databases. Because sage-grouse are a species of conservation concern and sensitive to activities during breeding, these data are accessible only through state wildlife agencies.
Data Caveats
CSU and USGS have used all available Wyoming male count data through 2023, and approximately 50% of Wyoming statewide data in 2024 (federal lands only), and no Wyoming data from 2025 onward.
Funders
U.S. Geological Survey (Ecosystem Mission Area, Land Management Research Program and Species Management Research Program; Wyoming Landscape Conservation Initiative) and the Bureau of Land Management.
Partners
State Wildlife Agencies (California Department of Fish and Wildlife; Colorado Parks and Wildlife; Idaho Department of Fish and Game; Montana Fish, Wildlife & Parks; Nevada Department of Wildlife; North Dakota Game and Fish Department; Oregon Department of Fish and Wildlife; South Dakota Department of Game, Fish and Parks; Utah Division of Wildlife Resources; Wyoming Game and Fish Department; Washington Department of Fish and Wildlife), Colorado State University, BLM, US Fish and Wildlife Service, US Forest Service, researchers who provided field data to evaluate results.

Greater Sage-Grouse Population Monitoring Framework: Cheat Sheet

Greater Sage-Grouse Population Monitoring Framework: Targeted Annual Warning System Information Sheet

Greater Sage-Grouse Population Monitoring Framework: Trends Analysis Information Sheet

Data Harmonization for Greater Sage-Grouse Populations

Greater Sage-Grouse Population Monitoring Framework: Frequently Asked Questions

Greater Sage-Grouse Population Monitoring Framework: Glossary of Terms

A user-friendly decision support tool for monitoring and managing greater sage-grouse populations

Greater Sage-Grouse Population Monitoring Framework Data Inputs Information Sheet

A targeted annual warning system (TAWS) for identifying aberrant declines in greater sage-grouse populations

Estimating trends for greater sage-grouse populations within highly stochastic environments
Hierarchical Units of Greater Sage-Grouse Populations Informing Wildlife Management
Greater sage-grouse (Centrocercus urophasianus) are at the center of state and national land use policies largely because of their unique life-history traits and their role as an ecological indicator for the health of sagebrush ecosystems. Multiple science centers with the U.S. Geological Survey (USGS) in conjunction with Colorado State University (CSU) have developed the Greater Sage-Grouse Population Monitoring Framework to support decision-making processes by U.S. Department of the Interior (Bureau of Land Management, U.S. Fish and Wildlife Service) and U.S. Department of Agriculture (U.S. Forest Service and Natural Resources Conservation Service) resource agencies for managing sage-grouse populations and the sagebrush ecosystems that they depend upon for survival and reproduction.
Framework Components
Read an overview of the framework and its components on this page, or explore individual components through the links below.
Background
Greater sage-grouse are a sagebrush-obligate bird that currently occupy most sagebrush ecosystems across 11 states in the U.S. and 2 Canadian Provinces in western North America. At the turn of the twenty-first century, sage-grouse occupied roughly half of their former historical range, and over the past three to five decades, they have demonstrated apparent population declines in many parts of their current range.
Sage-grouse are considered an indicator of the integrity of sagebrush ecosystems, as well as an umbrella species for the protection of other sagebrush species given their near-complete dependence on sagebrush ecosystems throughout their life. In 2015, the U.S. Fish and Wildlife Service determined greater sage-grouse were not warranted for listing under the Endangered Species Act. However, it was noted that maintaining sage-grouse populations at non-threatened levels and improving sage-grouse habitats and population health required greater integration of adaptive management into land-use planning. To meet this need, they suggested several different methods for sage-grouse population monitoring as current approaches made it difficult to manage and monitor sage-grouse across time and administrative boundaries. The Greater Sage-grouse Monitoring Framework and the SagePop application were designed to address these issues, providing a standardized and accurate way to track sage-grouse populations across the entire sagebrush biome and over time periods going back more than 40 years.
Research Objective
The purpose of the Greater Sage-Grouse Population Monitoring Framework is to allow managers to identify changing sage-grouse population trends and assess the influence of landscape characteristics on those trends across multiple spatial and temporal scales. The framework serves a dual purpose:
- allow sage-grouse population trends to be readily and accurately calculated at multiple spatial scales to meet best available science needs for state and federal resource agencies, and
- provide the basis for signaling the need for management actions by federal or state agencies to stabilize declining populations at different spatial scales.
The framework was developed in close collaboration with Western state wildlife agencies and multiple federal agency partners and is designed to provide annually updated results for timely management decisions and policy. It is comprised of five components, each with their own research objective and science deliverable.
1. Lek Database
Western state wildlife agencies identified the need for a single comprehensive database of lek count data and locations. The first component of the framework developed automated, repeatable methods for integrating lek-count data into a unified database. The software developed for this component enables the easy addition of new data to the database, thereby building the historical record of lek data and supporting timely analysis with the most up-to-date inputs.
More information on this data harmonization project.
2. Spatial Clusters
While understanding population trends within geographical units such as states or management districts is necessary for practitioners, populations may respond to environmental factors that do not align with these boundaries, as wildlife regularly move across jurisdictional boundaries. This component of the framework assessed and identified thirteen biologically relevant, hierarchically nested units of analysis that capture the drivers of population changes at different spatial scales (Figure 1). The framework analyzes population trends within three spatial scales: the climate cluster (regional - largest cluster scale), the neighborhood cluster (population - third smallest cluster scale), and the individual lek (local). The climate and neighborhood cluster scales are two of the 13 original products.
More information on the development of the clusters.
3. Greater Sage-grouse Trends
Sage-grouse populations naturally vary both within years and across approximately 9-year oscillations. This can complicate the estimation of sage-grouse trends over time. The framework used state-of-the-art models to identify six different low points in range-wide sage-grouse abundance from 1953 – 2024. Comparing population abundance across low points provides a more accurate estimate of trends over time.
More information on sage-grouse trends.
4. Targeted Annual Warning System (TAWS)
Understanding when and where populations are declining, and whether declines are attributable to factors that can be managed (for example, disturbances such as wildfire), can help managers develop effective management strategies. The targeted annual warning system (TAWS) identifies when a population or lek is declining at a rate that differs from the larger regional trend. This “signal” allows managers to distinguish regional declines driven by uncontrollable factors (for example, environmental conditions) from local declines attributable to disturbances that may be mitigated by management intervention.
The TAWS assigns a different severity (that is, a watch or warning) depending on the rate and duration of the decline. Watches may indicate the need for intensive monitoring, whereas warnings may signal the need for management interventions to stabilize populations. In addition, the TAWS informs managers when a population has signaled previously, informed by past patterns from lek count data, modeled across scales. This historical look at population signals promotes adaptive management by identifying persistent effects on population declines and by allowing managers to assess the outcomes of management actions.
More information about the Targeted Annual Warning System.
5. Web Tool
The framework is operationalized through a web-based decision-support tool called SagePop that allows partners to securely access trends and TAWS results for their area and period of interest. The application distills the results into relevant outputs such as maps, figures, and tables that can be directly incorporated into management plans. The framework's design promotes “living” products that are updated annually and loaded into the SagePop tool to facilitate timely management interventions and adaptive management.
More information on the SagePop web tool.
Co-production
We continue working with all collaborators to improve science, that is the foundation of these products and tools, which can help to inform sage-grouse management. Each year, we develop an updated version of a range-wide standardized lek count database to include new counts and historical corrections, and to improve data quality through rigorous quality-control and assurance methods. During this process, software is updated, peer-reviewed, and released to the public. The trends and TAWS models are then run annually with the most recent lek data provided by state partners. The results are released in a data series report and are then integrated back into the SagePop Tool for use by federal and state agency partners. We continue to inform partners of model updates and improvements and to facilitate the incorporation of new features and outputs into the application.
Data Restrictions
State wildlife agencies collect and manage lek databases. Because sage-grouse are a species of conservation concern and sensitive to activities during breeding, these data are accessible only through state wildlife agencies.
Data Caveats
CSU and USGS have used all available Wyoming male count data through 2023, and approximately 50% of Wyoming statewide data in 2024 (federal lands only), and no Wyoming data from 2025 onward.
Funders
U.S. Geological Survey (Ecosystem Mission Area, Land Management Research Program and Species Management Research Program; Wyoming Landscape Conservation Initiative) and the Bureau of Land Management.
Partners
State Wildlife Agencies (California Department of Fish and Wildlife; Colorado Parks and Wildlife; Idaho Department of Fish and Game; Montana Fish, Wildlife & Parks; Nevada Department of Wildlife; North Dakota Game and Fish Department; Oregon Department of Fish and Wildlife; South Dakota Department of Game, Fish and Parks; Utah Division of Wildlife Resources; Wyoming Game and Fish Department; Washington Department of Fish and Wildlife), Colorado State University, BLM, US Fish and Wildlife Service, US Forest Service, researchers who provided field data to evaluate results.
Greater Sage-Grouse Population Monitoring Framework: Cheat Sheet
Greater Sage-Grouse Population Monitoring Framework: Targeted Annual Warning System Information Sheet
Greater Sage-Grouse Population Monitoring Framework: Trends Analysis Information Sheet
Data Harmonization for Greater Sage-Grouse Populations
Greater Sage-Grouse Population Monitoring Framework: Frequently Asked Questions
Greater Sage-Grouse Population Monitoring Framework: Glossary of Terms
A user-friendly decision support tool for monitoring and managing greater sage-grouse populations
Greater Sage-Grouse Population Monitoring Framework Data Inputs Information Sheet
A targeted annual warning system (TAWS) for identifying aberrant declines in greater sage-grouse populations
Estimating trends for greater sage-grouse populations within highly stochastic environments