
The USGS Coastal Science Navigator serves as a gateway to USGS Coastal Change Hazards resources and assists users in finding products and tools that will meet their specific needs.
Images
Woods Hole Coastal and Marine Science Center images
Filter Total Items: 1298

USGS Coastal Science Navigator
The USGS Coastal Science Navigator serves as a gateway to USGS Coastal Change Hazards resources and assists users in finding products and tools that will meet their specific needs.

Surface elevation table measurements on a degraded marsh in Jamaica Bay, New York
Surface elevation table measurements on a degraded marsh in Jamaica Bay, New YorkJim Lynch (NPS) measuring marsh elevation change using a Surface Elevation Table (SET) near West Pond, Jamaica Bay, New York. Lateral erosion can reduce overall marsh area while elevation of the marsh at a point may be keeping pace with sea-level rise.

Conducting multichannel seismic operations at the main lab of the Research Vessel Marcus G. Langseth
Conducting multichannel seismic operations at the main lab of the Research Vessel Marcus G. LangsethMain lab of the Research Vessel Marcus G. Langseth (Columbia University - Lamont-Doherty Earth Observatory) while underway conducting multichannel seismic operations.
Spring 2023 Photo Contest Winner: Wayne Baldwin, Honorable Mention category

Coastal Change Likelihood Geonarrative
The Coastal Change Likelihood (CCL) assessment combines over twenty coastal data sources that describe the landscape and the hazards that act on it to determine the future likelihood of change on the coast in the next decade.
The Coastal Change Likelihood (CCL) assessment combines over twenty coastal data sources that describe the landscape and the hazards that act on it to determine the future likelihood of change on the coast in the next decade.

Herring River Restoration Project Groundbreaking Event
Herring River Restoration Project Groundbreaking EventMarcel Belaval (Deputy Director, USGS New England Water Science Center), Rob Thieler (Center Director, USGS Woods Hole Coastal and Marine Science Center), Brian Carlstrom (Superintendent, Cape Cod National Seashore, U.S.

Herring River Restoration Project
A sign at the Herring River Restoration Project Groundbreaking Event detailing restoration plans.
A sign at the Herring River Restoration Project Groundbreaking Event detailing restoration plans.

Herring River Restoration Project Groundbreaking Event
Herring River Restoration Project Groundbreaking EventRob Thieler, Meagan Eagle, and Sophie Kuhl of the U.S. Geological Survey, Woods Hole Coastal and Marine Science Center posing with the “Salt Marshes: A Carbon Bank in Our Backyard” sign near the Herring River.

Herring River Restoration Project Groundbreaking Event
Herring River Restoration Project Groundbreaking EventKevin Kroeger, Research Chemist with the U.S. Geological Survey, Woods Hole Coastal and Marine Science Center, talking about blue carbon research with Congressman Bill Keating at the Herring River Restoration Project groundbreaking event.

Herring River Restoration Project Groundbreaking Event
Herring River Restoration Project Groundbreaking EventThe USGS celebrating the groundbreaking of the Herring River restoration!
Herring River Restoration Project Groundbreaking Event
Herring River Restoration Project Groundbreaking EventThe USGS celebrating the groundbreaking of the Herring River restoration!

Herring River Restoration Project Groundbreaking Event
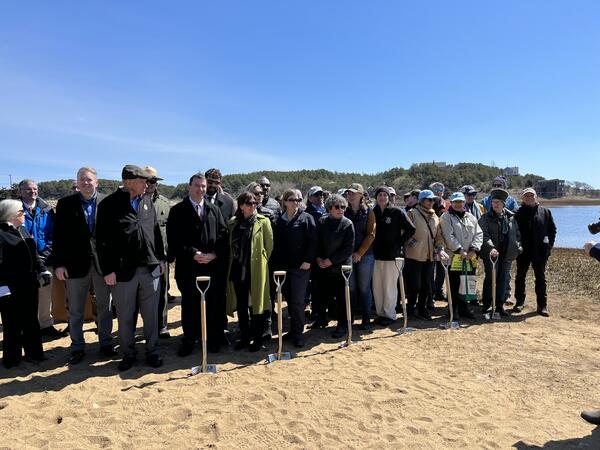
Herring River Restoration Project Groundbreaking EventState and Federal officials joined partners involved in the Herring River Restoration Project for a group photo at the groundbreaking event at Chequessett Neck bridge in Wellfleet, Massachusetts.
Herring River Restoration Project Groundbreaking Event
Herring River Restoration Project Groundbreaking EventState and Federal officials joined partners involved in the Herring River Restoration Project for a group photo at the groundbreaking event at Chequessett Neck bridge in Wellfleet, Massachusetts.

Herring River Restoration Project Groundbreaking Event
Herring River Restoration Project Groundbreaking EventKevin Kroeger, Marcel Belaval, and Rob Thieler of the U.S. Geological Survey talking with other collaborators involved in the Herring River Restoration Project.
Herring River Restoration Project Groundbreaking Event
Herring River Restoration Project Groundbreaking EventKevin Kroeger, Marcel Belaval, and Rob Thieler of the U.S. Geological Survey talking with other collaborators involved in the Herring River Restoration Project.

Herring River Bridge
The Chequessett Neck bridge in Wellfleet, Massachusetts, the construction site of the first and largest infrastructure component of the Herring River Restoration Project.
The Chequessett Neck bridge in Wellfleet, Massachusetts, the construction site of the first and largest infrastructure component of the Herring River Restoration Project.

Herring River Restoration Project Groundbreaking Event
Herring River Restoration Project Groundbreaking EventMeagan Eagle, Research Physical Scientist with the U.S. Geological Survey, Woods Hole Coastal and Marine Science Center, talking about USGS contributions to the Herring River Restoration Project with Congressman Bill Keating at the groundbreaking event.

Herring River Restoration Project Groundbreaking Event
Herring River Restoration Project Groundbreaking EventState and Federal officials joined partners involved in the Herring River Restoration Project for a group photo at the groundbreaking event at Chequessett Neck bridge in Wellfleet, Massachusetts.

Herring River Restoration Project Groundbreaking Event
Herring River Restoration Project Groundbreaking EventThe USGS celebrating the groundbreaking of the Herring River restoration!
Herring River Restoration Project Groundbreaking Event
Herring River Restoration Project Groundbreaking EventThe USGS celebrating the groundbreaking of the Herring River restoration!

Herring River Restoration Project Groundbreaking Event
Herring River Restoration Project Groundbreaking EventThe USGS attendees of the Herring River Restoration Project groundbreaking event standing proudly next to a sign detailing the project.
Herring River Restoration Project Groundbreaking Event
Herring River Restoration Project Groundbreaking EventThe USGS attendees of the Herring River Restoration Project groundbreaking event standing proudly next to a sign detailing the project.

Herring River Restoration Project Groundbreaking Event
Herring River Restoration Project Groundbreaking EventKevin Kroeger, Marcel Belaval, and Rob Thieler of the U.S. Geological Survey talking with other collaborators involved in the Herring River Restoration Project.
Herring River Restoration Project Groundbreaking Event
Herring River Restoration Project Groundbreaking EventKevin Kroeger, Marcel Belaval, and Rob Thieler of the U.S. Geological Survey talking with other collaborators involved in the Herring River Restoration Project.

Ellen Lalk
Ellen Lalk is a stable isotope biogeochemist who focuses on the sources and fates of methane in marine and freshwater environments. At the USGS she is using analytical chemistry methods (e.g., laser spectroscopy, mass spectrometry, and gas chromatography) and fieldwork to better understand the transformation of methane-derived organic matter.
Ellen Lalk is a stable isotope biogeochemist who focuses on the sources and fates of methane in marine and freshwater environments. At the USGS she is using analytical chemistry methods (e.g., laser spectroscopy, mass spectrometry, and gas chromatography) and fieldwork to better understand the transformation of methane-derived organic matter.

CCL Hazards
Map showing the hazards type layer, which highlights the hazard type (event or perpetual) that may be most influential in coastal change for A, the northeastern United States and B, detail for the outer extent of Cape Cod in eastern Massachusetts.
Map showing the hazards type layer, which highlights the hazard type (event or perpetual) that may be most influential in coastal change for A, the northeastern United States and B, detail for the outer extent of Cape Cod in eastern Massachusetts.