
Around the world, scientists are using the Coupled Ocean-Atmosphere-Waves-Sediment Transport (COAWST) Modeling System to better understand and forecast short-term changes in coastal conditions.
Images
Woods Hole Coastal and Marine Science Center images
Filter Total Items: 1334
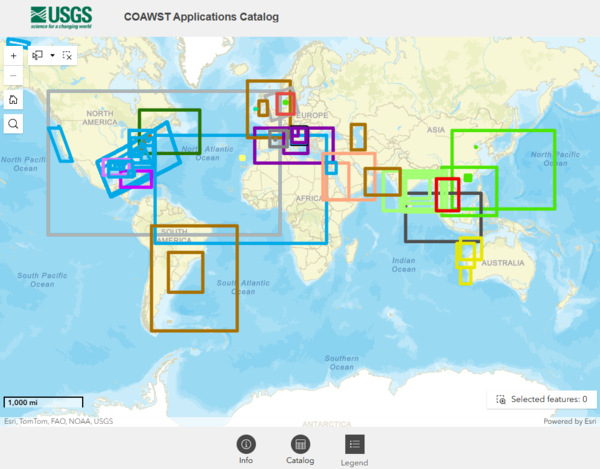
COAWST Applications Catalog
Around the world, scientists are using the Coupled Ocean-Atmosphere-Waves-Sediment Transport (COAWST) Modeling System to better understand and forecast short-term changes in coastal conditions.
2026 Long Island Sound Research Conference
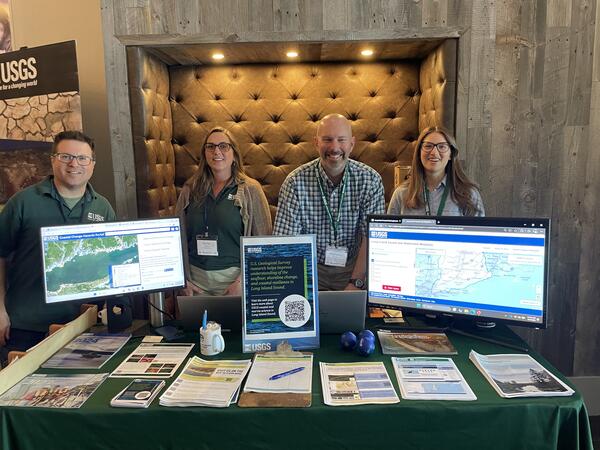
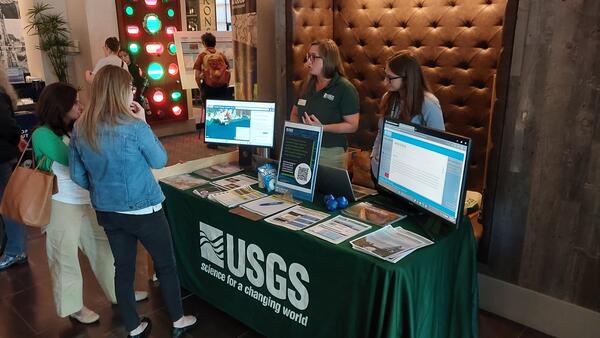
USGS scientists (left to right) Seth Ackerman, Rachel Henderson, Chris Schubert, and Gina Groseclose hosting a booth at the 2026 Long Island Sound Research Conference.
USGS scientists (left to right) Seth Ackerman, Rachel Henderson, Chris Schubert, and Gina Groseclose hosting a booth at the 2026 Long Island Sound Research Conference.
2026 Long Island Sound Research Conference
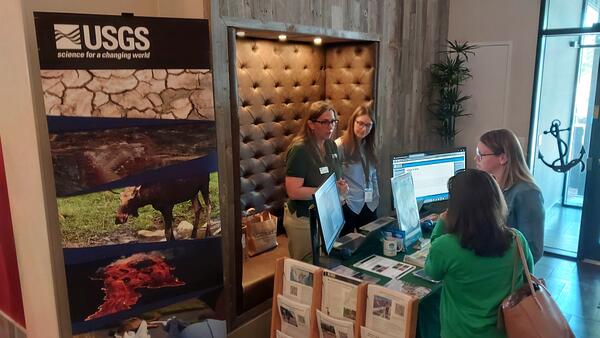
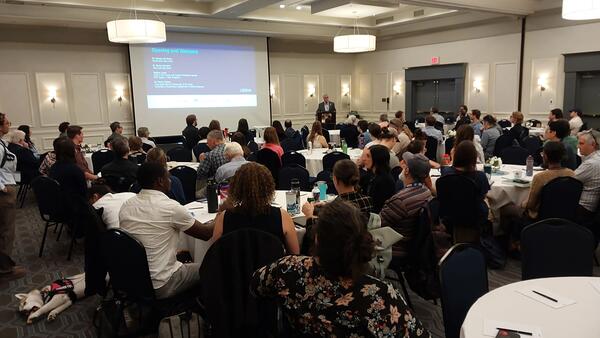
The 2026 Long Island Sound Research Conference brings together researchers, managers, academia, and community partners to share the latest science and strengthen collaborations focused on the future of Long Island Sound. This year, the U.S.
The 2026 Long Island Sound Research Conference brings together researchers, managers, academia, and community partners to share the latest science and strengthen collaborations focused on the future of Long Island Sound. This year, the U.S.
2026 Long Island Sound Research Conference
The 2026 Long Island Sound Research Conference brings together researchers, managers, academia, and community partners to share the latest science and strengthen collaborations focused on the future of Long Island Sound. This year, the U.S.
The 2026 Long Island Sound Research Conference brings together researchers, managers, academia, and community partners to share the latest science and strengthen collaborations focused on the future of Long Island Sound. This year, the U.S.
CCL for Long Beach and Whitehall Beach
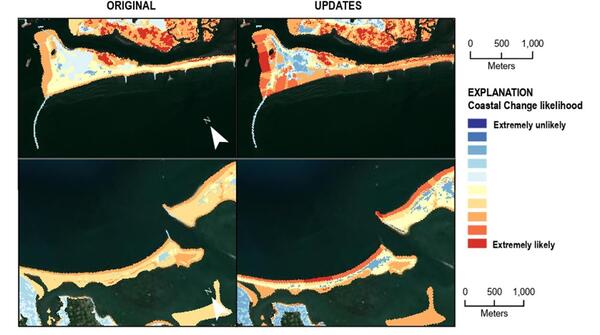
Maps showing the results of the Coastal Change Likelihood (CCL) for Long Beach, CT (top), and for Whitehall Beach, NY (bottom).
Maps showing the results of the Coastal Change Likelihood (CCL) for Long Beach, CT (top), and for Whitehall Beach, NY (bottom).
Long-Term Shoreline Change for Long Island Sound
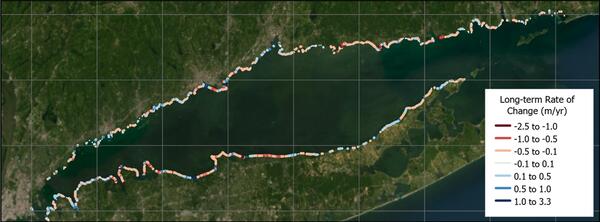
Map showing long-term shoreline change rate variations for coastal Long Island Sound.
Map showing long-term shoreline change rate variations for coastal Long Island Sound.
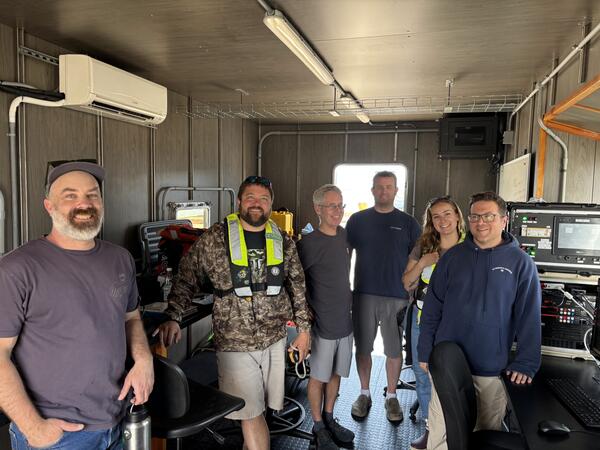
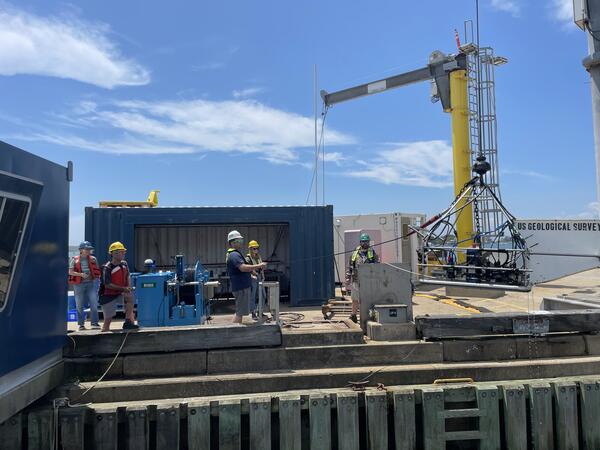
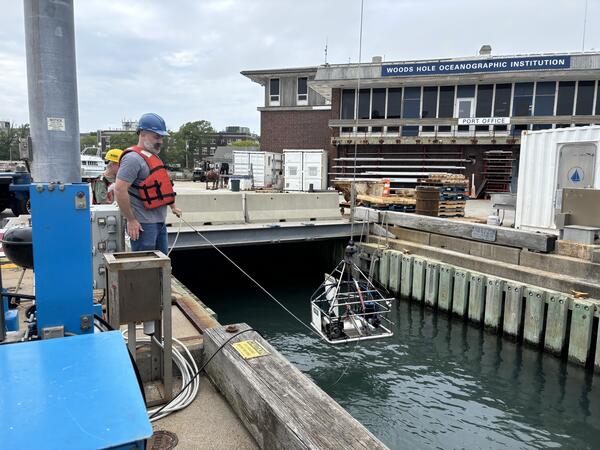
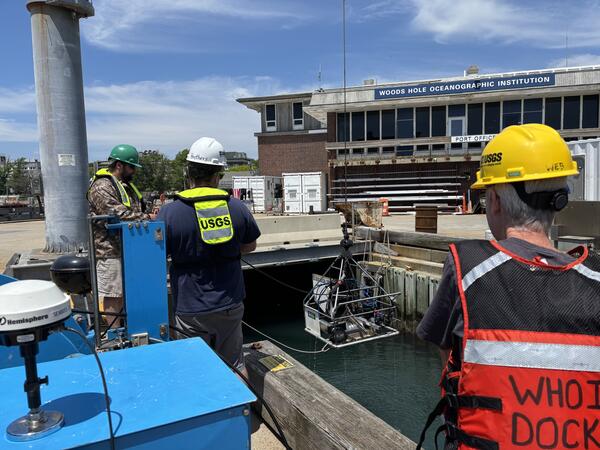
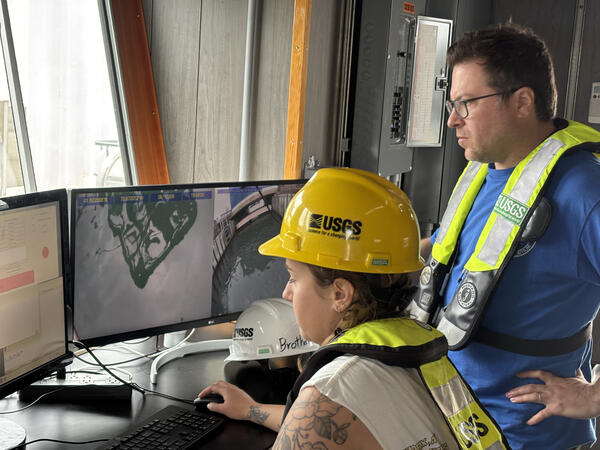
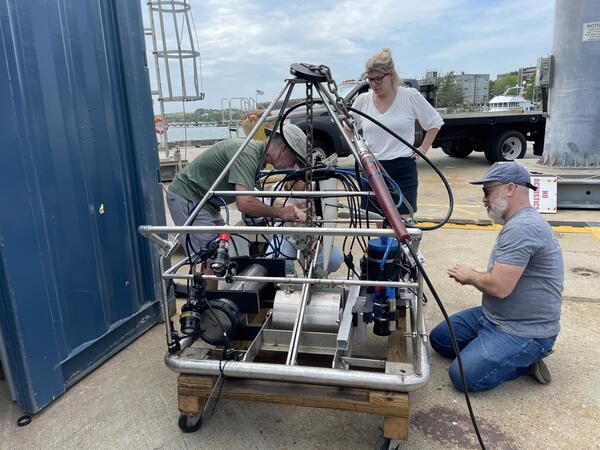
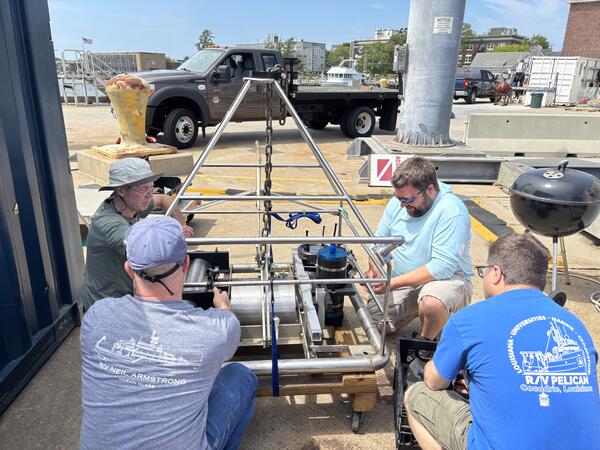
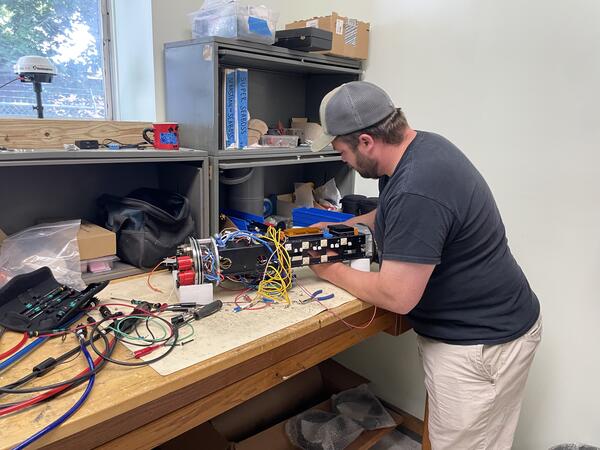
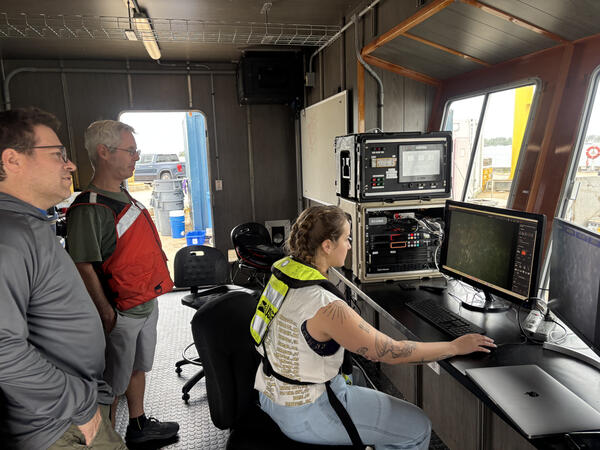
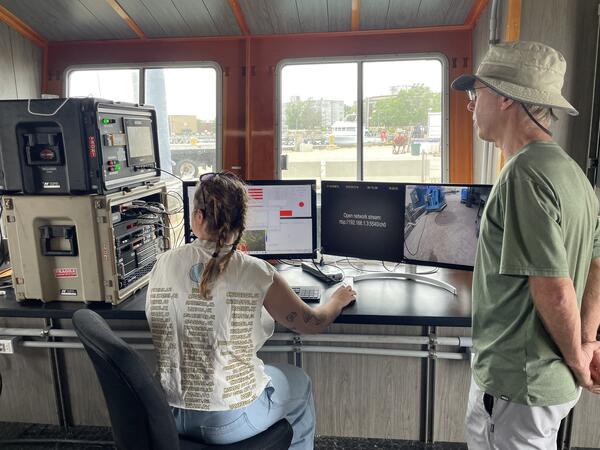
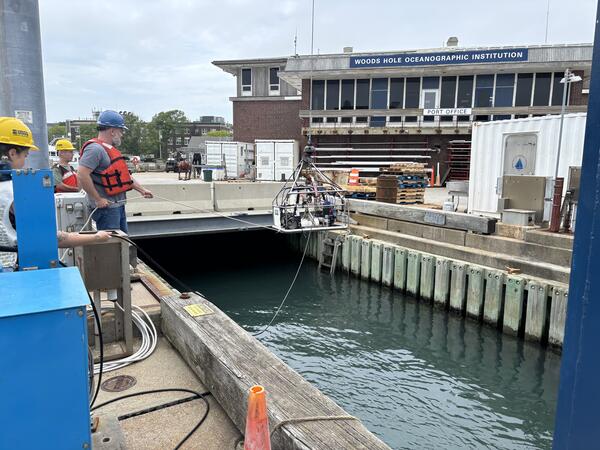
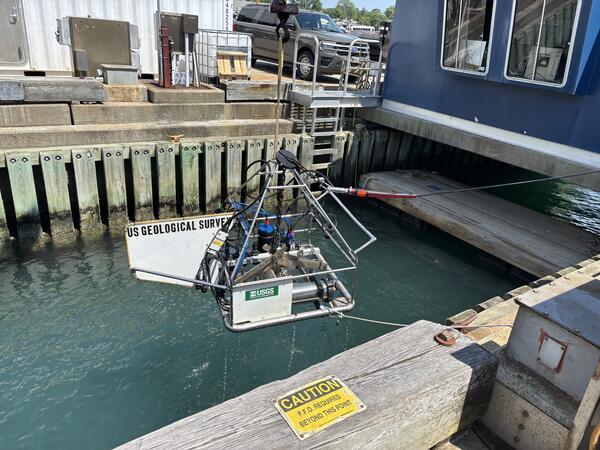
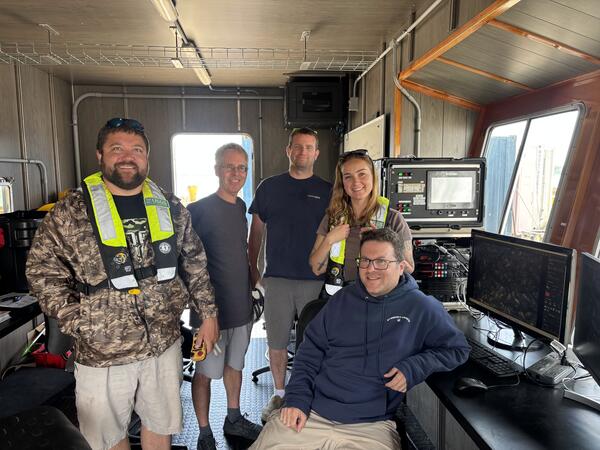
SEABOSS 3.0 Test
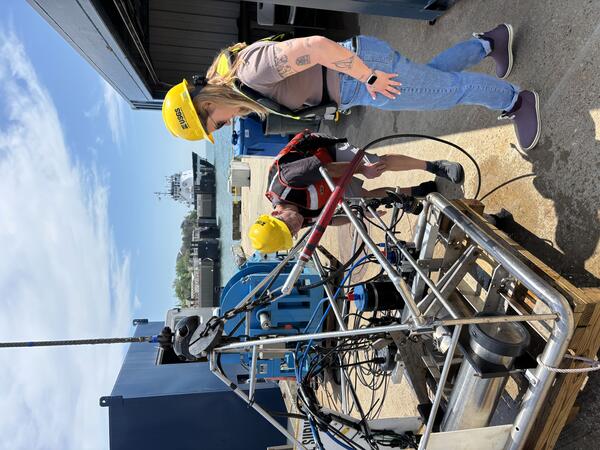
The next generation of the Seabed Observation and Sampling System—SEABOSS 3.0—is steadily coming to life.
The next generation of the Seabed Observation and Sampling System—SEABOSS 3.0—is steadily coming to life.
SEABOSS 3.0 Test
The next generation of the Seabed Observation and Sampling System—SEABOSS 3.0—is steadily coming to life.
The next generation of the Seabed Observation and Sampling System—SEABOSS 3.0—is steadily coming to life.
SEABOSS 3.0 Test
The next generation of the Seabed Observation and Sampling System—SEABOSS 3.0—is steadily coming to life.
The next generation of the Seabed Observation and Sampling System—SEABOSS 3.0—is steadily coming to life.
SEABOSS 3.0 Test
The next generation of the Seabed Observation and Sampling System—SEABOSS 3.0—is steadily coming to life.
The next generation of the Seabed Observation and Sampling System—SEABOSS 3.0—is steadily coming to life.
SEABOSS 3.0 Test
The next generation of the Seabed Observation and Sampling System—SEABOSS 3.0—is steadily coming to life.
The next generation of the Seabed Observation and Sampling System—SEABOSS 3.0—is steadily coming to life.
SEABOSS 3.0 Test
The next generation of the Seabed Observation and Sampling System—SEABOSS 3.0—is steadily coming to life.
The next generation of the Seabed Observation and Sampling System—SEABOSS 3.0—is steadily coming to life.
SEABOSS 3.0 Test
The next generation of the Seabed Observation and Sampling System—SEABOSS 3.0—is steadily coming to life.
The next generation of the Seabed Observation and Sampling System—SEABOSS 3.0—is steadily coming to life.
SEABOSS 3.0 Test
The next generation of the Seabed Observation and Sampling System—SEABOSS 3.0—is steadily coming to life.
The next generation of the Seabed Observation and Sampling System—SEABOSS 3.0—is steadily coming to life.
SEABOSS 3.0 Test
The next generation of the Seabed Observation and Sampling System—SEABOSS 3.0—is steadily coming to life.
The next generation of the Seabed Observation and Sampling System—SEABOSS 3.0—is steadily coming to life.
SEABOSS 3.0 Test
The next generation of the Seabed Observation and Sampling System—SEABOSS 3.0—is steadily coming to life.
The next generation of the Seabed Observation and Sampling System—SEABOSS 3.0—is steadily coming to life.
SEABOSS 3.0 Test
The next generation of the Seabed Observation and Sampling System—SEABOSS 3.0—is steadily coming to life.
The next generation of the Seabed Observation and Sampling System—SEABOSS 3.0—is steadily coming to life.
SEABOSS 3.0 Test
The next generation of the Seabed Observation and Sampling System—SEABOSS 3.0—is steadily coming to life.
The next generation of the Seabed Observation and Sampling System—SEABOSS 3.0—is steadily coming to life.
SEABOSS 3.0 Test
The next generation of the Seabed Observation and Sampling System—SEABOSS 3.0—is steadily coming to life.
The next generation of the Seabed Observation and Sampling System—SEABOSS 3.0—is steadily coming to life.
SEABOSS 3.0 TEST
The next generation of the Seabed Observation and Sampling System—SEABOSS 3.0—is steadily coming to life.
The next generation of the Seabed Observation and Sampling System—SEABOSS 3.0—is steadily coming to life.