
Around the world, scientists are using the Coupled Ocean-Atmosphere-Waves-Sediment Transport (COAWST) Modeling System to better understand and forecast short-term changes in coastal conditions.
Multimedia
Multimedia products produced by Woods Hole Coastal and Marine Science Center staff
Images
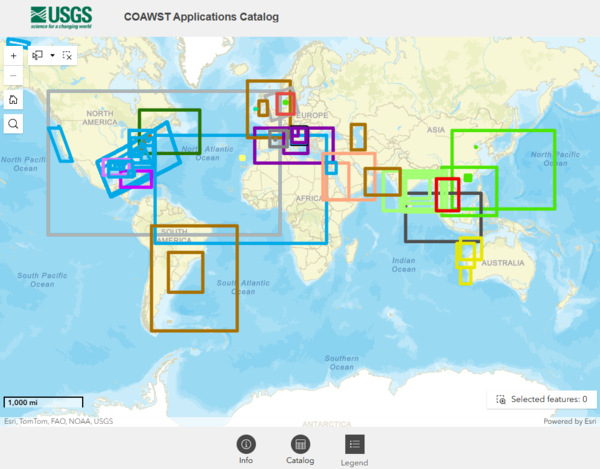
COAWST Applications Catalog
Around the world, scientists are using the Coupled Ocean-Atmosphere-Waves-Sediment Transport (COAWST) Modeling System to better understand and forecast short-term changes in coastal conditions.
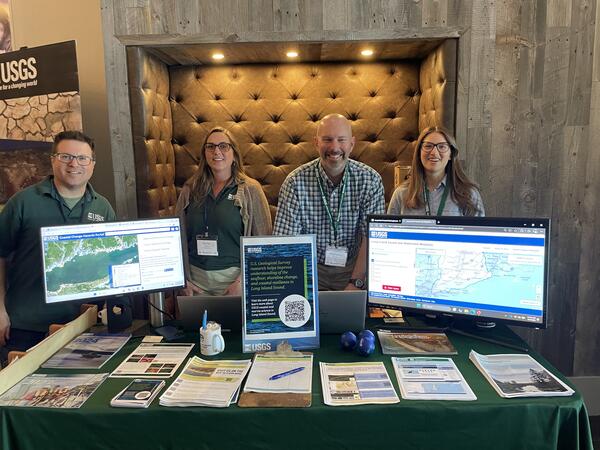
2026 Long Island Sound Research Conference
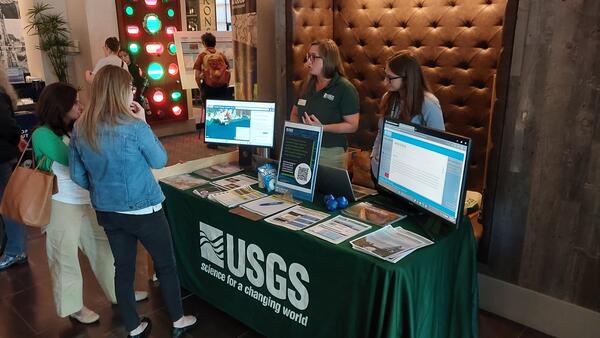
USGS scientists (left to right) Seth Ackerman, Rachel Henderson, Chris Schubert, and Gina Groseclose hosting a booth at the 2026 Long Island Sound Research Conference.
USGS scientists (left to right) Seth Ackerman, Rachel Henderson, Chris Schubert, and Gina Groseclose hosting a booth at the 2026 Long Island Sound Research Conference.
2026 Long Island Sound Research Conference
The 2026 Long Island Sound Research Conference brings together researchers, managers, academia, and community partners to share the latest science and strengthen collaborations focused on the future of Long Island Sound. This year, the U.S.
The 2026 Long Island Sound Research Conference brings together researchers, managers, academia, and community partners to share the latest science and strengthen collaborations focused on the future of Long Island Sound. This year, the U.S.
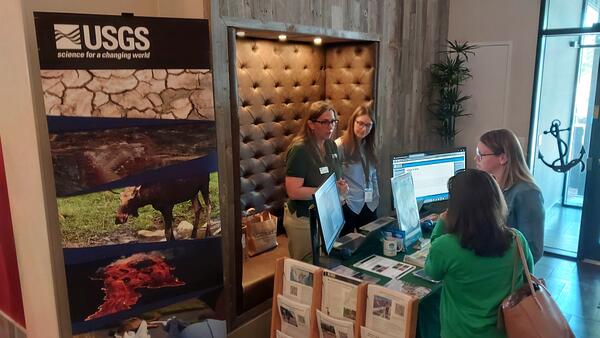
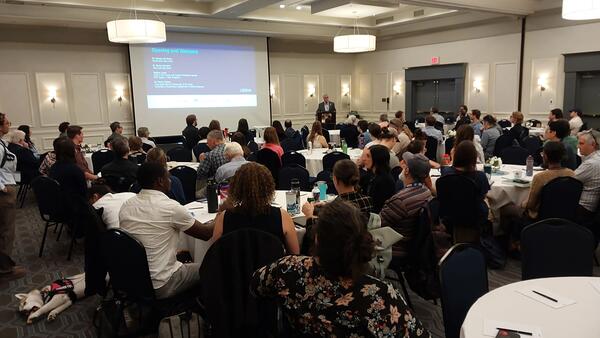
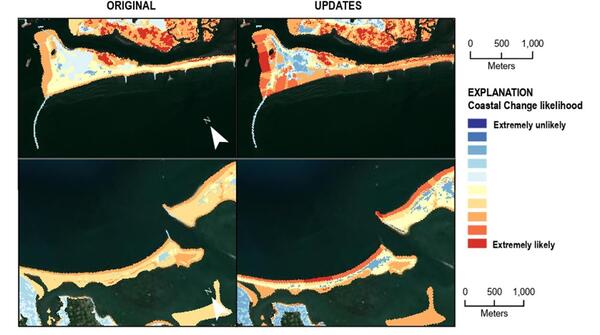
CCL for Long Beach and Whitehall Beach
Maps showing the results of the Coastal Change Likelihood (CCL) for Long Beach, CT (top), and for Whitehall Beach, NY (bottom).
Maps showing the results of the Coastal Change Likelihood (CCL) for Long Beach, CT (top), and for Whitehall Beach, NY (bottom).
Videos

USGS Coastal and Marine Field Operations
To conduct the science needed to understand coastal and marine geohazards, support habitat and resource management, and monitor how these environments change over time, the USGS Coastal and Marine Hazards and Resources Program relies on engineering, mechanical, and electronics expertise for field operations along the coast, in the nearshore environment, and in the d
To conduct the science needed to understand coastal and marine geohazards, support habitat and resource management, and monitor how these environments change over time, the USGS Coastal and Marine Hazards and Resources Program relies on engineering, mechanical, and electronics expertise for field operations along the coast, in the nearshore environment, and in the d

The USGS Northeast Region: Delivering Science for Better Decisions
The USGS Northeast Region: Delivering Science for Better DecisionsThis video is an introduction of the USGS Northeast Region's science efforts to support society's evolving needs through its engaged and skilled workforce.
The USGS Northeast Region: Delivering Science for Better Decisions
The USGS Northeast Region: Delivering Science for Better DecisionsThis video is an introduction of the USGS Northeast Region's science efforts to support society's evolving needs through its engaged and skilled workforce.

Introduction to the USGS Coastal Science Navigator
Introduction to the USGS Coastal Science NavigatorThe Coastal Science Navigator is intended to help users discover USGS Coastal Change Hazards information, products, and tools relevant to their scientific or decision-making needs.
Introduction to the USGS Coastal Science Navigator
Introduction to the USGS Coastal Science NavigatorThe Coastal Science Navigator is intended to help users discover USGS Coastal Change Hazards information, products, and tools relevant to their scientific or decision-making needs.

Flyover of the U.S. Coastline
Our Nation’s coastlines are almost 100,000 miles long. These extensive coastal areas stretch from Maine’s Atlantic shores in the northeast, south along the shores of the Gulf of Mexico and insular areas in the Caribbean.
Our Nation’s coastlines are almost 100,000 miles long. These extensive coastal areas stretch from Maine’s Atlantic shores in the northeast, south along the shores of the Gulf of Mexico and insular areas in the Caribbean.

Assateague Island National Seashore
sUAS coastal Imagery collected by the Woods Hole Coastal and Marine Science Center Aerial Imaging and Mapping group (AIM) at Assateague Island National Seashore October 10-14th, 2022.
sUAS coastal Imagery collected by the Woods Hole Coastal and Marine Science Center Aerial Imaging and Mapping group (AIM) at Assateague Island National Seashore October 10-14th, 2022.
Webcams

Marconi Beach video camera 1 variance image
Two video cameras are mounted on a bluff above Marconi Beach, Cape Cod National Seashore, Wellfleet, MA. Every half hour, the video cameras collect imagery for 10 minutes.
Two video cameras are mounted on a bluff above Marconi Beach, Cape Cod National Seashore, Wellfleet, MA. Every half hour, the video cameras collect imagery for 10 minutes.

Marconi Beach video camera 2 variance image
Two video cameras are mounted on a bluff above Marconi Beach, Cape Cod National Seashore, Wellfleet, MA. Every half hour, the video cameras collect imagery for 10 minutes.
Two video cameras are mounted on a bluff above Marconi Beach, Cape Cod National Seashore, Wellfleet, MA. Every half hour, the video cameras collect imagery for 10 minutes.
Marconi Beach video camera 1 dark image
Two video cameras are mounted on a bluff above Marconi Beach, Cape Cod National Seashore, Wellfleet, MA. Every half hour, the video cameras collect imagery for 10 minutes. This is the “dark” image, the darkest pixel values throughout the video, useful for tracking sediment plumes, tracking floating debris, and filtering out breaking waves.
Two video cameras are mounted on a bluff above Marconi Beach, Cape Cod National Seashore, Wellfleet, MA. Every half hour, the video cameras collect imagery for 10 minutes. This is the “dark” image, the darkest pixel values throughout the video, useful for tracking sediment plumes, tracking floating debris, and filtering out breaking waves.

Marconi Beach video camera 2 dark image
Two video cameras are mounted on a bluff above Marconi Beach, Cape Cod National Seashore, Wellfleet, MA. Every half hour, the video cameras collect imagery for 10 minutes. This is the “dark” image, the darkest pixel values throughout the video, useful for tracking sediment plumes, tracking floating debris, and filtering out breaking waves.
Two video cameras are mounted on a bluff above Marconi Beach, Cape Cod National Seashore, Wellfleet, MA. Every half hour, the video cameras collect imagery for 10 minutes. This is the “dark” image, the darkest pixel values throughout the video, useful for tracking sediment plumes, tracking floating debris, and filtering out breaking waves.

Marconi Beach video camera 2 snapshot
Two video cameras are mounted on a bluff above Marconi Beach, Cape Cod National Seashore, Wellfleet, MA. Every half hour during daylight hours, the video camera collects imagery for 10 minutes and processes it. This is the snapshot image, like a photo, taken at the beginning of the 10-minute window and looking east.
Two video cameras are mounted on a bluff above Marconi Beach, Cape Cod National Seashore, Wellfleet, MA. Every half hour during daylight hours, the video camera collects imagery for 10 minutes and processes it. This is the snapshot image, like a photo, taken at the beginning of the 10-minute window and looking east.

Marconi Beach video camera 1 snapshot
Two video cameras are mounted on a bluff above Marconi Beach, Cape Cod National Seashore, Wellfleet, MA. Every half hour during daylight hours, the video camera collects imagery for 10 minutes and processes it. This is the snapshot image, like a photo, taken at the beginning of the 10-minute window and looking northeast.
Two video cameras are mounted on a bluff above Marconi Beach, Cape Cod National Seashore, Wellfleet, MA. Every half hour during daylight hours, the video camera collects imagery for 10 minutes and processes it. This is the snapshot image, like a photo, taken at the beginning of the 10-minute window and looking northeast.