
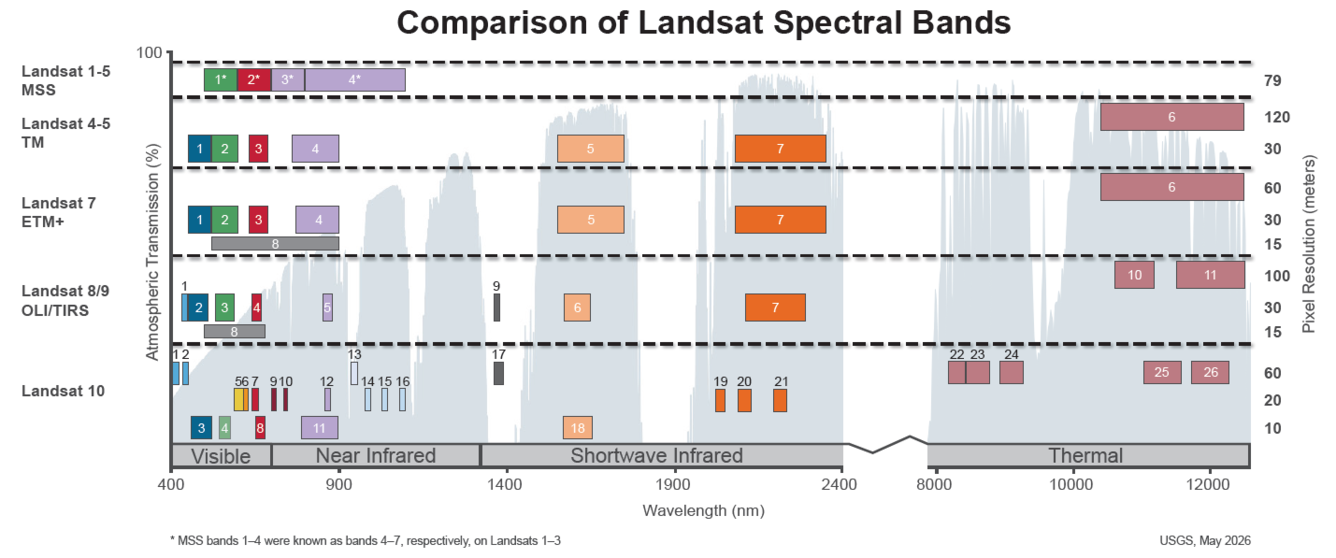
This image shows the spectral bandpasses for the sensors on all Landsat satellites.
What are the band designations for the Landsat satellites?
The sensors carried on the Landsat satellites acquired data in different wavelengths within the electromagnetic spectrum. Technological advancements have drastically improved the data collected since 1972:
The Multispectral Scanner (MSS) carried on Landsat 1,2,3,4 and 5 collected data in four ranges (bands).
The Thematic Mapper (TM) sensor on Landsat 4 and Landsat 5 included bands in the same ranges found on earlier satellites and added a thermal and a shortwave infrared band.
Landsat 7 carried the Enhanced Thematic Mapper Plus (ETM+) sensor which retained the bands from the TM, while adding a panchromatic band.
Landsat 8 and Landsat 9 carried two sensors - the Operational Land Imager (OLI) and the Thermal Infrared Sensor (TIRS).
Landsat 10, planned for launch in 2031, will carry a sensor that acquires data in 26 bands throughout the visible, near infrared, shortwave infrared, and thermal spectrums.
Media
Sources/Usage: Public Domain. View Media Details
Click on image for larger version
Landsat 10 images will consist of 26 spectral bands:
10 new spectral bands to support emerging applications such as harmful algal bloom detection, snow hydrology and ice dynamics, crop residue mapping, and vegetation health and stress
Two new aerosol and water vapor retrieval spectral bands to improve and autonomously correct for atmospheric effects
Five Sentinel-2 current generation complementary spectral bands for observational synergy
11 refined, heritage Landsat spectral bands
Five thermal infrared spectral bands to support improved surface temperature and emissivity retrieval, snow grain size, and mineral characterization applications
| Landsat 10 Bands | Wavelength (micrometers) | Ground Resolution (meters) |
|---|---|---|
| Band 1 - Violet | 0.402 - 0.422 | 60 |
| Band 2 - Coastal/Aerosol | 0.433 - 0.453 | 20 |
| Band 3 - Blue | 0.457 - 0.523 | 10 |
| Band 4 - Green | 0.5425 - 0.5775 | 10 |
| Band 5 - Yellow | 0.585 - 0.615 | 20 |
| Band 6 - Orange | 0.610 - 0.630 | 20 |
| Band 7 - Red 1 | 0.640 - 0.660 | 20 |
| Band 8 - Red 2 | 0.650 - 0.680 | 10 |
| Band 9 - Red Edge 1 | 0.6975 - 0.7125 | 20 |
| Band 10 - Red Edge 2 | 0.7325 - 0.7475 | 20 |
| Band 11 - Near Infrared (NIR) Board | 0.7845 - 0.8995 | 10 |
| Band 12 - NIR 1 | 0.855 - 0.875 | 20 |
| Band 13 - Water Vapor | 0.935 - 0.955 | 60 |
| Band 14 - Liquid Water | 0.975 - 0.995 | 20 |
| Band 15 - Snow/Ice 1 | 1.025 - 1.045 | 20 |
| Band 16 - Snow/Ice 2 | 1.080 - 1.100 | 20 |
| Band 17 - Cirrus | 1.360 - 1.390 | 60 |
| Band 18 - Shortwave-Infrared-1 (SWIR-1) | 1.565 - 1655 | 10 |
| Band 19 - Shortwave-Infrared-2 (SWIR-2) | 2.0255 - 2.0505 | 20 |
| Band 20 - SWIR 2b | 2.088 - 2.128 | 20 |
| Band 21 - SWIR 2c | 2.191 - 2.231 | 20 |
| Band 22 - Thermal (TIR) 1 | 8.175 - 8.425 | 60 |
| Band 23 - Thermal (TIR) 2 | 8.425 - 8.775 | 60 |
| Band 24 - Thermal (TIR) 3 | 8.928 - 9.275 | 60 |
| Band 25 - Thermal (TIR) 4 | 11.025 - 11.575 | 60 |
| Band 26 - Thermal (TIR) 5 | 11.725 - 12.275 | 60 |
Landsat 8 and Landsat 9 Operational Land Imager (OLI) and Thermal Infrared Sensor (TIRS) images consist of nine spectral bands, and two thermal bands. The approximate scene size is 170 km north-south by 183 km east-west (106 mi by 114 mi).
| Landsat 8-9 Bands | Wavelength (micrometers) | Ground Resolution (meters) |
|---|---|---|
| Band 1 - Coastal aerosol | 0.43 - 0.45 | 30 |
| Band 2 - Blue | 0.45 - 0.51 | 30 |
| Band 3 - Green | 0.53 - 0.59 | 30 |
| Band 4 - Red | 0.64 - 0.67 | 30 |
| Band 5 - Near Infrared (NIR) | 0.85 - 0.88 | 30 |
| Band 6 - Shortwave Infrared (SWIR) 1 | 1.57 - 1.65 | 30 |
| Band 7 - Shortwave Infrared (SWIR) 2 | 2.11 - 2.29 | 30 |
| Band 8 - Panchromatic | 0.50 - 0.68 | 15 |
| Band 9 - Cirrus | 1.36 - 1.38 | 30 |
| Band 10 - Thermal Infrared (TIRS) 1 | 10.6 - 11.19 | 100 (resampled to 30)* |
| Band 11 - Thermal Infrared (TIRS) 2 | 11.50 - 12.51 | 100 (resampled to 30)* |
Landsat 7 Enhanced Thematic Mapper Plus (ETM+) images consist of eight spectral bands All of the bands can collect one of two gain settings (high or low) for increased radiometric sensitivity and dynamic range, while Band 6 collects both high and low gain for all scenes. The approximate scene size is 170 km north-south by 183 km east-west (106 mi by 114 mi).
| Landsat 7 Bands | Wavelength (micrometers) | Ground Resolution (meters) |
|---|---|---|
| Band 1 - Blue | 0.45 - 0.52 | 30 |
| Band 2 - Green | 0.52 - 0.60 | 30 |
| Band 3 - Red | 0.63 - 0.69 | 30 |
| Band 4 - Near Infrared (NIR) | 0.77 - 0.90 | 30 |
| Band 5 - Shortwave Infrared (SWIR) 1 | 1.55 - 1.75 | 30 |
| Band 6 - Thermal | 10.40 - 12.50 | 60 (resampled to 30)* |
| Band 7 - Shortwave Infrared (SWIR) 2 | 2.09 - 2.35 | 30 |
| Band 8 - Panchromatic | 0.52 - 0.90 | 15 |
Landsat 4-5 Thematic Mapper (TM) images consist of seven spectral bands The approximate scene size is 170 km north-south by 183 km east-west (106 mi by 114 mi).
| Landsat 4-5 TM Bands | Wavelength (micrometers) | Ground Resolution (meters) |
|---|---|---|
| Band 1 - Blue | 0.45 - 0.52 | 30 |
| Band 2 - Green | 0.52 - 0.60 | 30 |
| Band 3 - Red | 0.63 - 0.69 | 30 |
| Band 4 - Near Infrared (NIR) | 0.76 - 0.90 | 30 |
| Band 5 - Shortwave Infrared (SWIR) 1 | 1.55 - 1.75 | 30 |
| Band 6 - Thermal | 10.40 - 12.50 | 120 (resampled to 30)* |
| Band 7 - Shortwave Infrared (SWIR) 2 | 2.08 - 2.35 | 30 |
Landsat 1-5 Multispectral Scanner (MSS) images consist of four spectral bands. The approximate scene size is 170 km north-south by 185 km east-west (106 mi by 115 mi). Specific band designations differ from Landsat 1-3 to Landsat 4-5.
| Landsat 1-3 MSS Bands | Landsat 4-5 MSS Bands | Wavelength (micrometers) | Ground Resolution (meters) |
|---|---|---|---|
| Band 4 - Green | Band 1 - Green | 0.5 - 0.6 | 60 |
| Band 5 - Red | Band 2 = Red | 0.6 - 0.7 | 60 |
| Band 6 - Near Infrared (NIR) | Band 3 - Near Infrared (NIR) | 0.7 - 0.8 | 60 |
| Band 7 - Near Infrared (NIR) | Band 4 - Near Infrared (NIR) | 0.8 - 1.1 | 60 |
* Indicates that acquired data are resampled for Level-1 product processing.
Related

What are the best Landsat spectral bands for use in my research? What are the best Landsat spectral bands for use in my research?
The Spectral Characteristics Viewer is an interactive tool that can be used to visualize how the bands, or channels, of different satellite sensors measure the intensity of the many wavelengths (colors) of light. This is also known as the relative spectral response (RSR). By overlaying the spectral curves from different features (spectra), one can determine which bands of the selected sensor will...

How does data from Sentinel-2A’s MultiSpectral Instrument compare to Landsat data? How does data from Sentinel-2A’s MultiSpectral Instrument compare to Landsat data?
The Sentinel-2A MultiSpectral Instrument (MSI) data has spectral bands very similar to Landsat 8 and 9 (excluding the thermal bands of Thermal Infrared Sensor (TIRS)). All Sentinel-2 data are freely available from the Copernicus Open Access Hub; therefore, users are encouraged to download the data via https://dataspace.copernicus.eu/explore-data/data-collections/sentinel-…. To learn...

What are some known issues that users might find in Landsat data? What are some known issues that users might find in Landsat data?
A number of artifacts and anomalies can happen to any remote sensing data. Banding, dropped scan lines, and detector failures are only a few of the anomalies that can be seen in Landsat data. Go to Landsat Known Issues for details about anomalies that have been discovered and investigated.

After a Landsat scene is collected, when will it become available for search and download? After a Landsat scene is collected, when will it become available for search and download?
Landsat scenes become available through EarthExplorer within 6 hours after acquisition and become visible in GloVis within 24 hours. See Landsat Acquisitions for acquisition calendars and information about daily schedules.

Can Landsat satellite acquisition requests be made for a specific date and location? Can Landsat satellite acquisition requests be made for a specific date and location?
The Landsat 8 and Landsat 9 satellites together acquire approximately 1,500 scenes daily. These scenes are available for download within 6 hours of acquisition. Landsat satellite acquisitions are managed as a system, known as a satellite constellation. Long-Term Acquisition Plans (LTAPs) direct and optimize the daily acquisitions of each active Landsat satellite. Special requests for future...

Spectral Bandpasses for all Landsat Sensors
This image shows the spectral bandpasses for the sensors on all Landsat satellites.

Common Landsat Band Combinations
This graphic displays a few of the common band Red-Green-Blue (RGB) combinations of Landsat data. For more information about using Landsat bands in your research, visit the following pages:
This graphic displays a few of the common band Red-Green-Blue (RGB) combinations of Landsat data. For more information about using Landsat bands in your research, visit the following pages:

Landsat in Action - Infrastructure of Landsat Data with Matt Hansen
Landsat in Action - Infrastructure of Landsat Data with Matt HansenMatt Hansen talks about the value of Landsat data as an infrastructure for research and innovation.
Landsat in Action - Infrastructure of Landsat Data with Matt Hansen
Landsat in Action - Infrastructure of Landsat Data with Matt HansenMatt Hansen talks about the value of Landsat data as an infrastructure for research and innovation.

Landsat in Action - The Accuracy of Landsat with Jeff Masek
Landsat in Action - The Accuracy of Landsat with Jeff MasekLandsat 9 Project Scientist Jeff Masek discusses the ways Landsat data is used and how important it is to have high quality data.
Landsat in Action - The Accuracy of Landsat with Jeff Masek
Landsat in Action - The Accuracy of Landsat with Jeff MasekLandsat 9 Project Scientist Jeff Masek discusses the ways Landsat data is used and how important it is to have high quality data.

Landsat Collections
Landsat Collections: Providing a Stable Environmental Record for Time Series Analysis
Landsat Collections: Providing a Stable Environmental Record for Time Series Analysis

Every Pixel - Landsat's Sensors
On board Landsat 8 are two sensors that capture data about earth's surface. Here is an explanation of the instruments that capture every pixel.
On board Landsat 8 are two sensors that capture data about earth's surface. Here is an explanation of the instruments that capture every pixel.
")
Landsat Analysis Ready Data (ARD)
The U.S. Geological Survey (USGS) has improved Landsat data quality and usability through the creation of Analysis Ready Data (ARD) for the conterminous United States, Alaska, and Hawaii. Landsat ARD greatly reduces the preparatory work currently required to do time-series analysis for understanding landscape change for operational and science users.
The U.S. Geological Survey (USGS) has improved Landsat data quality and usability through the creation of Analysis Ready Data (ARD) for the conterminous United States, Alaska, and Hawaii. Landsat ARD greatly reduces the preparatory work currently required to do time-series analysis for understanding landscape change for operational and science users.

Landsat Collections — What are Tiers?
This is the third video in a series describing the new U.S. Geological Survey (USGS) Landsat Collection 1 inventory structure. Collection 1 required the reprocessing of all archived Landsat data to achieve radiometric and geometric consistency of Level-1 products through time and across all Landsat sensors.
This is the third video in a series describing the new U.S. Geological Survey (USGS) Landsat Collection 1 inventory structure. Collection 1 required the reprocessing of all archived Landsat data to achieve radiometric and geometric consistency of Level-1 products through time and across all Landsat sensors.

Land of Terror
No water. No vegetation. No oases. Known as the "Land of Terror," the Tanezrouft Basin in Algeria is one of the most desolate parts of the Sahara Desert. Sand dunes, which appear in yellow, streak down the left side of the image, and sandstone formations carved by relentless wind erosion make concentric loops, much like the grain seen in a piece of wood.
No water. No vegetation. No oases. Known as the "Land of Terror," the Tanezrouft Basin in Algeria is one of the most desolate parts of the Sahara Desert. Sand dunes, which appear in yellow, streak down the left side of the image, and sandstone formations carved by relentless wind erosion make concentric loops, much like the grain seen in a piece of wood.

2012 Landsat Top Ten Loop
A "Top Ten" video of locations featuring land change, as captured by USGS Landsat
A "Top Ten" video of locations featuring land change, as captured by USGS Landsat
Related
What are the best Landsat spectral bands for use in my research? What are the best Landsat spectral bands for use in my research?
The Spectral Characteristics Viewer is an interactive tool that can be used to visualize how the bands, or channels, of different satellite sensors measure the intensity of the many wavelengths (colors) of light. This is also known as the relative spectral response (RSR). By overlaying the spectral curves from different features (spectra), one can determine which bands of the selected sensor will...
How does data from Sentinel-2A’s MultiSpectral Instrument compare to Landsat data? How does data from Sentinel-2A’s MultiSpectral Instrument compare to Landsat data?
The Sentinel-2A MultiSpectral Instrument (MSI) data has spectral bands very similar to Landsat 8 and 9 (excluding the thermal bands of Thermal Infrared Sensor (TIRS)). All Sentinel-2 data are freely available from the Copernicus Open Access Hub; therefore, users are encouraged to download the data via https://dataspace.copernicus.eu/explore-data/data-collections/sentinel-…. To learn...
What are some known issues that users might find in Landsat data? What are some known issues that users might find in Landsat data?
A number of artifacts and anomalies can happen to any remote sensing data. Banding, dropped scan lines, and detector failures are only a few of the anomalies that can be seen in Landsat data. Go to Landsat Known Issues for details about anomalies that have been discovered and investigated.
After a Landsat scene is collected, when will it become available for search and download? After a Landsat scene is collected, when will it become available for search and download?
Landsat scenes become available through EarthExplorer within 6 hours after acquisition and become visible in GloVis within 24 hours. See Landsat Acquisitions for acquisition calendars and information about daily schedules.
Can Landsat satellite acquisition requests be made for a specific date and location? Can Landsat satellite acquisition requests be made for a specific date and location?
The Landsat 8 and Landsat 9 satellites together acquire approximately 1,500 scenes daily. These scenes are available for download within 6 hours of acquisition. Landsat satellite acquisitions are managed as a system, known as a satellite constellation. Long-Term Acquisition Plans (LTAPs) direct and optimize the daily acquisitions of each active Landsat satellite. Special requests for future...
Spectral Bandpasses for all Landsat Sensors
This image shows the spectral bandpasses for the sensors on all Landsat satellites.
This image shows the spectral bandpasses for the sensors on all Landsat satellites.
Common Landsat Band Combinations
This graphic displays a few of the common band Red-Green-Blue (RGB) combinations of Landsat data. For more information about using Landsat bands in your research, visit the following pages:
This graphic displays a few of the common band Red-Green-Blue (RGB) combinations of Landsat data. For more information about using Landsat bands in your research, visit the following pages:
Landsat in Action - Infrastructure of Landsat Data with Matt Hansen
Landsat in Action - Infrastructure of Landsat Data with Matt HansenMatt Hansen talks about the value of Landsat data as an infrastructure for research and innovation.
Landsat in Action - Infrastructure of Landsat Data with Matt Hansen
Landsat in Action - Infrastructure of Landsat Data with Matt HansenMatt Hansen talks about the value of Landsat data as an infrastructure for research and innovation.
Landsat in Action - The Accuracy of Landsat with Jeff Masek
Landsat in Action - The Accuracy of Landsat with Jeff MasekLandsat 9 Project Scientist Jeff Masek discusses the ways Landsat data is used and how important it is to have high quality data.
Landsat in Action - The Accuracy of Landsat with Jeff Masek
Landsat in Action - The Accuracy of Landsat with Jeff MasekLandsat 9 Project Scientist Jeff Masek discusses the ways Landsat data is used and how important it is to have high quality data.
Landsat Collections
Landsat Collections: Providing a Stable Environmental Record for Time Series Analysis
Landsat Collections: Providing a Stable Environmental Record for Time Series Analysis
Every Pixel - Landsat's Sensors
On board Landsat 8 are two sensors that capture data about earth's surface. Here is an explanation of the instruments that capture every pixel.
On board Landsat 8 are two sensors that capture data about earth's surface. Here is an explanation of the instruments that capture every pixel.
Landsat Analysis Ready Data (ARD)
The U.S. Geological Survey (USGS) has improved Landsat data quality and usability through the creation of Analysis Ready Data (ARD) for the conterminous United States, Alaska, and Hawaii. Landsat ARD greatly reduces the preparatory work currently required to do time-series analysis for understanding landscape change for operational and science users.
The U.S. Geological Survey (USGS) has improved Landsat data quality and usability through the creation of Analysis Ready Data (ARD) for the conterminous United States, Alaska, and Hawaii. Landsat ARD greatly reduces the preparatory work currently required to do time-series analysis for understanding landscape change for operational and science users.
Landsat Collections — What are Tiers?
This is the third video in a series describing the new U.S. Geological Survey (USGS) Landsat Collection 1 inventory structure. Collection 1 required the reprocessing of all archived Landsat data to achieve radiometric and geometric consistency of Level-1 products through time and across all Landsat sensors.
This is the third video in a series describing the new U.S. Geological Survey (USGS) Landsat Collection 1 inventory structure. Collection 1 required the reprocessing of all archived Landsat data to achieve radiometric and geometric consistency of Level-1 products through time and across all Landsat sensors.
Land of Terror
No water. No vegetation. No oases. Known as the "Land of Terror," the Tanezrouft Basin in Algeria is one of the most desolate parts of the Sahara Desert. Sand dunes, which appear in yellow, streak down the left side of the image, and sandstone formations carved by relentless wind erosion make concentric loops, much like the grain seen in a piece of wood.
No water. No vegetation. No oases. Known as the "Land of Terror," the Tanezrouft Basin in Algeria is one of the most desolate parts of the Sahara Desert. Sand dunes, which appear in yellow, streak down the left side of the image, and sandstone formations carved by relentless wind erosion make concentric loops, much like the grain seen in a piece of wood.
2012 Landsat Top Ten Loop
A "Top Ten" video of locations featuring land change, as captured by USGS Landsat
A "Top Ten" video of locations featuring land change, as captured by USGS Landsat
Updated Date: July 20, 2026