Map of fish collection streams (n= 1,196) for 57 species within the Chesapeake Bay watershed
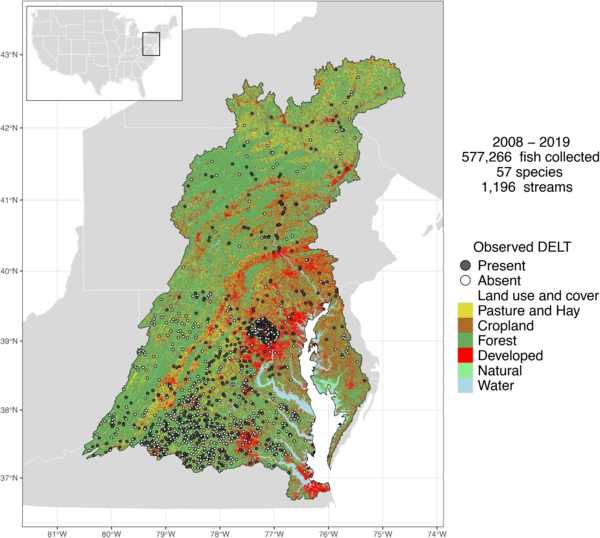
Map of fish collection streams (n= 1,196) for 57 species within the Chesapeake Bay watershedFish collection streams (n= 1,196) for 57 species within the Chesapeake Bay watershed (black outline). Grey circles indicate the presence of observed DELT, and white circles indicate its absence, in at least one individual fish at each stream. Major land use and land cover were obtained from the Chesapeake Bay Program (2023).