U.S. flag

An official website of the United States government

Multimedia

USGS translates our science from reports and journal articles, and engages stakeholders, to inform restoration and conservation decisions across the Chesapeake watershed. Multimedia information includes geologic maps, and from publications, videos, and Geonarratives that provide stories and maps about selected findings.

Images

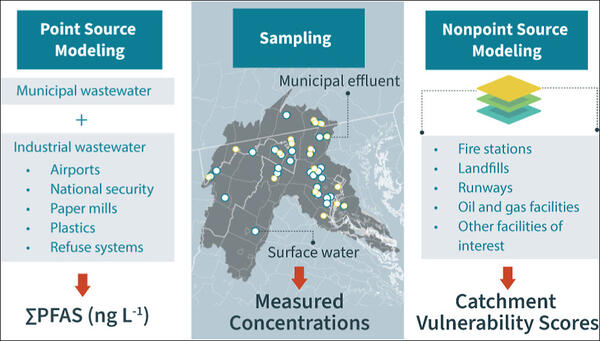
Conceptual diagram of the measurement and modeling approaches used in this study

Conceptual diagram of the measurement and modeling approaches used in this study. ΣPFAS (ng/L), summed concentration of PFAS in nanograms per liter.

Conceptual diagram of the measurement and modeling approaches used in this study. ΣPFAS (ng/L), summed concentration of PFAS in nanograms per liter.

Map of Potomac Watershed
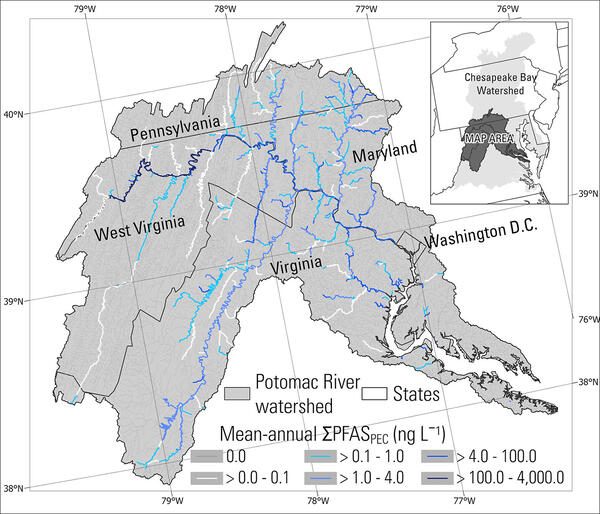
Map showing predicted environmental concentrations (PEC) of PFAS in Potomac River watershed streams

Map showing predicted environmental concentrations (PEC) of PFAS in Potomac River watershed streams, where PFAS is represented as the summed concentration of eight PFAS found in wastewater treatment plant discharges, in nanograms per liter (ng/L).

Map showing predicted environmental concentrations (PEC) of PFAS in Potomac River watershed streams, where PFAS is represented as the summed concentration of eight PFAS found in wastewater treatment plant discharges, in nanograms per liter (ng/L).

Map of the Chesapeake Bay Nontidal Network showing Total inorganic N trends and changes in flow-normalized yield, 2014-2023
Chesapeake Bay Nontidal Network: 2014-2023 Total Nitrate + Nitrate 10-year Trends and Change in Flow-normalized Per Acre Loads

This map displays the 10-year trend for total nitrate + nitrogen (also known as inorganic nitrogen), as well as the total change in flow-normalized loads per acre for total nitrate + nitrite across the Chesapeake Bay Watershed from 2014 to 2023. 

This map displays the 10-year trend for total nitrate + nitrogen (also known as inorganic nitrogen), as well as the total change in flow-normalized loads per acre for total nitrate + nitrite across the Chesapeake Bay Watershed from 2014 to 2023. 

Map of the Chesapeake Bay Nontidal Network showing Orthophosphate trends and changes in flow-normalized yield, 2014-2023
Chesapeake Bay Nontidal Network: 2014-2023 Orthophosphate 10-year Trends and Change in Flow-normalized Per Acre Loads

This map displays the 10-year trend for orthophosphate, as well as the total change in flow-normalized loads per acre for orthophosphate across the Chesapeake Bay Watershed from 2014 to 2023. 

This map displays the 10-year trend for orthophosphate, as well as the total change in flow-normalized loads per acre for orthophosphate across the Chesapeake Bay Watershed from 2014 to 2023. 

Map of the Chesapeake Bay Nontidal Network showing Total Nitrogen trends and changes in flow-normalized yield, 2014-2023
Chesapeake Bay Nontidal Network: 2014-2023 Total Nitrogen 10-year Trends and Change in Flow-normalized Per Acre Loads

This map displays the 10-year trend for total nitrogen, as well as the total change in flow-normalized loads per acre for total nitrogen across the Chesapeake Bay Watershed from 2014 to 2023. 

This map displays the 10-year trend for total nitrogen, as well as the total change in flow-normalized loads per acre for total nitrogen across the Chesapeake Bay Watershed from 2014 to 2023. 

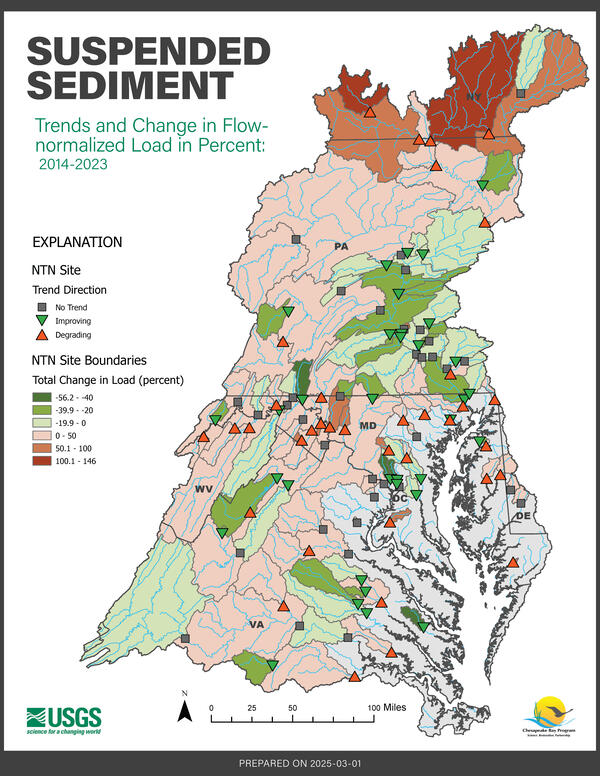
Map of the Chesapeake Bay Nontidal Network showing suspended sediment trends and changes in flow-normalized yield, 2014-2023
Chesapeake Bay Nontidal Network: 2014-2023 Suspended Sediment 10-year Trends and Change in Flow-normalized Per Acre Loads

This map displays the 10-year trend for suspended sediment, as well as the total change in flow-normalized loads per acre for suspended sediment across the Chesapeake Bay Watershed from 2014 to 2023. 

This map displays the 10-year trend for suspended sediment, as well as the total change in flow-normalized loads per acre for suspended sediment across the Chesapeake Bay Watershed from 2014 to 2023. 

Videos

Screenshot image showing title of video, USGS identifier, and photo of broad river with shoreline and sky Susquehanna River Story — What does the science say about water quality?
Susquehanna River Story — What does the science say about water quality?

Narrated presentation that provides a unique synthesis of the story of nutrient water quality in the Susquehanna watershed.

Narrated presentation that provides a unique synthesis of the story of nutrient water quality in the Susquehanna watershed.

Close up of running water with the text, "Soaking Up Stormwater". Soaking Up Stormwater (AD)
Soaking Up Stormwater (AD)

This video acts as a “visual abstract” for a recent publication analyzing the stormwater management practices in Clarksburg, MD. The video features interviews with the team of USGS scientists as well as a water specialist from Montgomery County.

This video acts as a “visual abstract” for a recent publication analyzing the stormwater management practices in Clarksburg, MD. The video features interviews with the team of USGS scientists as well as a water specialist from Montgomery County.

Close up of running water with the text, "Soaking Up Stormwater". Soaking Up Stormwater
Soaking Up Stormwater

This video acts as a “visual abstract” for a recent publication analyzing the stormwater management practices in Clarksburg, MD. The video features interviews with the team of USGS scientists as well as a water specialist from Montgomery County.

This video acts as a “visual abstract” for a recent publication analyzing the stormwater management practices in Clarksburg, MD. The video features interviews with the team of USGS scientists as well as a water specialist from Montgomery County.

A photo of a scientist collecting a water sample behind the words 'Chesapeake Bay Status and Trends' Chesapeake Bay Status and Trends (AD)
Chesapeake Bay Status and Trends (AD)

The Chesapeake Bay is one of the Nation's largest ecosystem restoration efforts, so monitoring to assess changes in condition is crucial. The USGS is monitoring the status and trends of key indicators for the health of streams and rivers in the Chesapeake Bay watershed.

The Chesapeake Bay is one of the Nation's largest ecosystem restoration efforts, so monitoring to assess changes in condition is crucial. The USGS is monitoring the status and trends of key indicators for the health of streams and rivers in the Chesapeake Bay watershed.

A photo of a scientist collecting a water sample behind the words 'Chesapeake Bay Status and Trends' Chesapeake Bay Status and Trends
Chesapeake Bay Status and Trends

The Chesapeake Bay is one of the Nation's largest ecosystem restoration efforts, so monitoring to assess changes in condition is crucial. The USGS is monitoring the status and trends of key indicators for the health of streams and rivers in the Chesapeake Bay watershed.

The Chesapeake Bay is one of the Nation's largest ecosystem restoration efforts, so monitoring to assess changes in condition is crucial. The USGS is monitoring the status and trends of key indicators for the health of streams and rivers in the Chesapeake Bay watershed.

USGS symbol and title text on image of coastal forest landscape and bay Nitrogen in the Chesapeake Bay Watershed: A Century of Change
Nitrogen in the Chesapeake Bay Watershed: A Century of Change

Narrated presentation that provides a unique, long-term perspective (1950-2050) of the major drivers of nitrogen change up to the present, and forecasts how they may affect nitrogen into the future for the Chesapeake Bay watershed. Information is based off of U.S. Geological Survey Circular 1486.

Narrated presentation that provides a unique, long-term perspective (1950-2050) of the major drivers of nitrogen change up to the present, and forecasts how they may affect nitrogen into the future for the Chesapeake Bay watershed. Information is based off of U.S. Geological Survey Circular 1486.

Was this page helpful?